01
Data:
Processing the Data
~ 19.01.2025
PREPROCESSING THE DATA
-
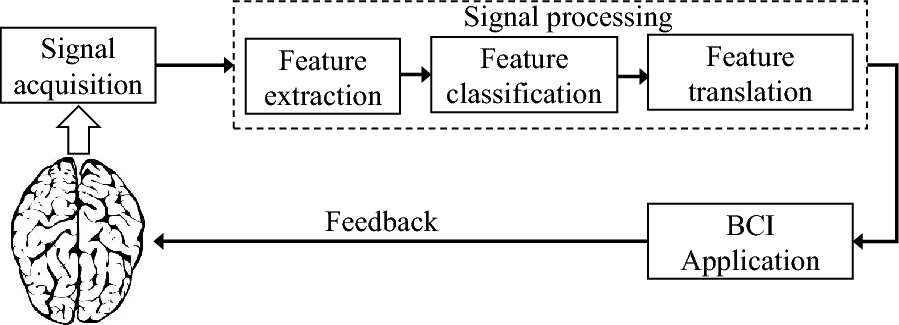
Diagram of a Brain Computer Interface (BCI)
Here is a refresher on BCIs: A Brain-Computer Interface (BCI) is a system that enables direct communication between the brain and external devices, so users can control software or hardware using neural signals. The Muse 2 headband, a consumer-grade EEG device, provides an accessible entry point into BCI development. Released in late 2018, the Muse 2 is equipped with sensors that measure brain activity (EEG), heart rate, motion, and other physiological data. While it is marketed primarily as a neurofeedback tool for meditation, its versatility has inspired a range of applications, from hands-free control systems to personalised digital experiences.
-
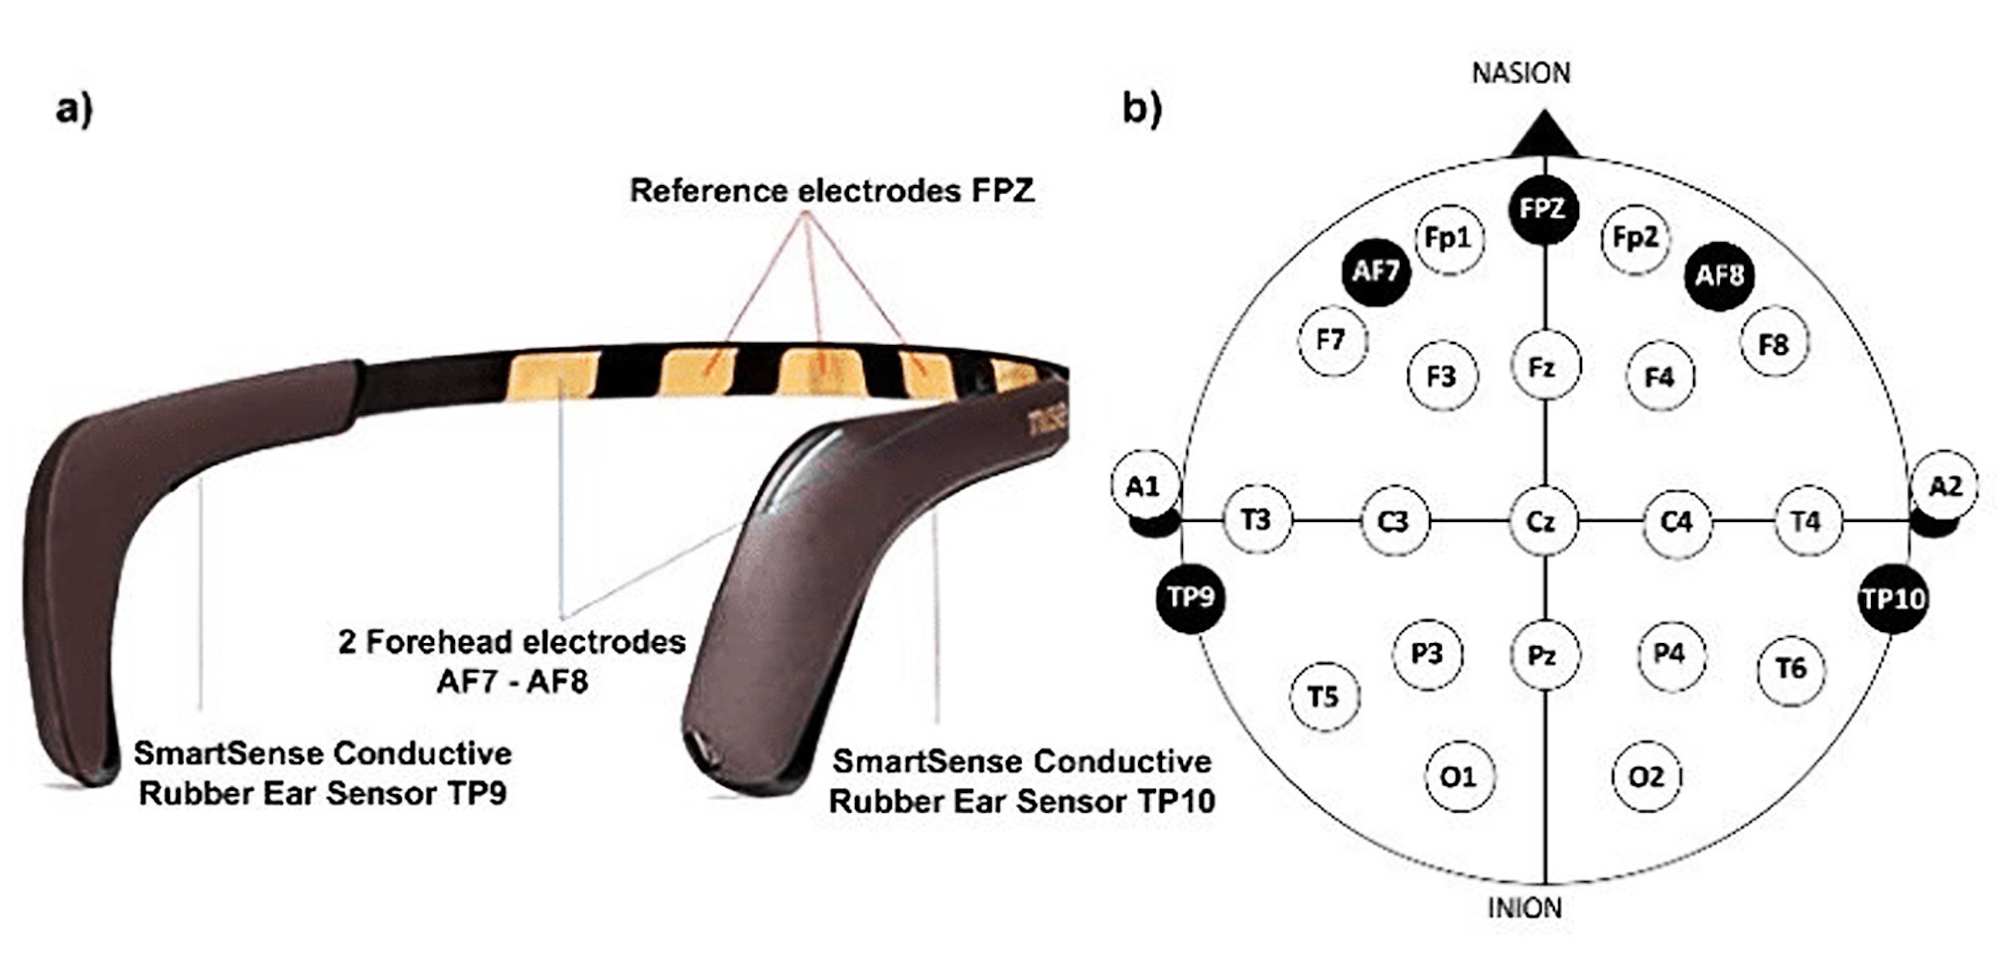
Diagram of the Muse 2 headband and the placement of electrodes
The Muse 2 measures EEG signals through four dry electrodes: two on the forehead (AF7 and AF8), which capture frontal lobe activity, and two above the ears (TP9 and TP10), which measure signals from the temporal lobe. These electrodes enable the detection of brainwave patterns such as Alpha (8–12 Hz) and Beta (13–30 Hz), associated with relaxation and focus, respectively. For developers, the Muse 2 offers flexibility for building custom applications using software development kits (SDKs) and open-source libraries.
Software Development Kit (SDK)
An SDK is a collection of software tools, libraries, and
documentation designed to help developers create applications for specific hardware or software
platforms. In the context of Muse 2, SDKs like BrainFlow provide interfaces for streaming, filtering,
and analysing EEG data.
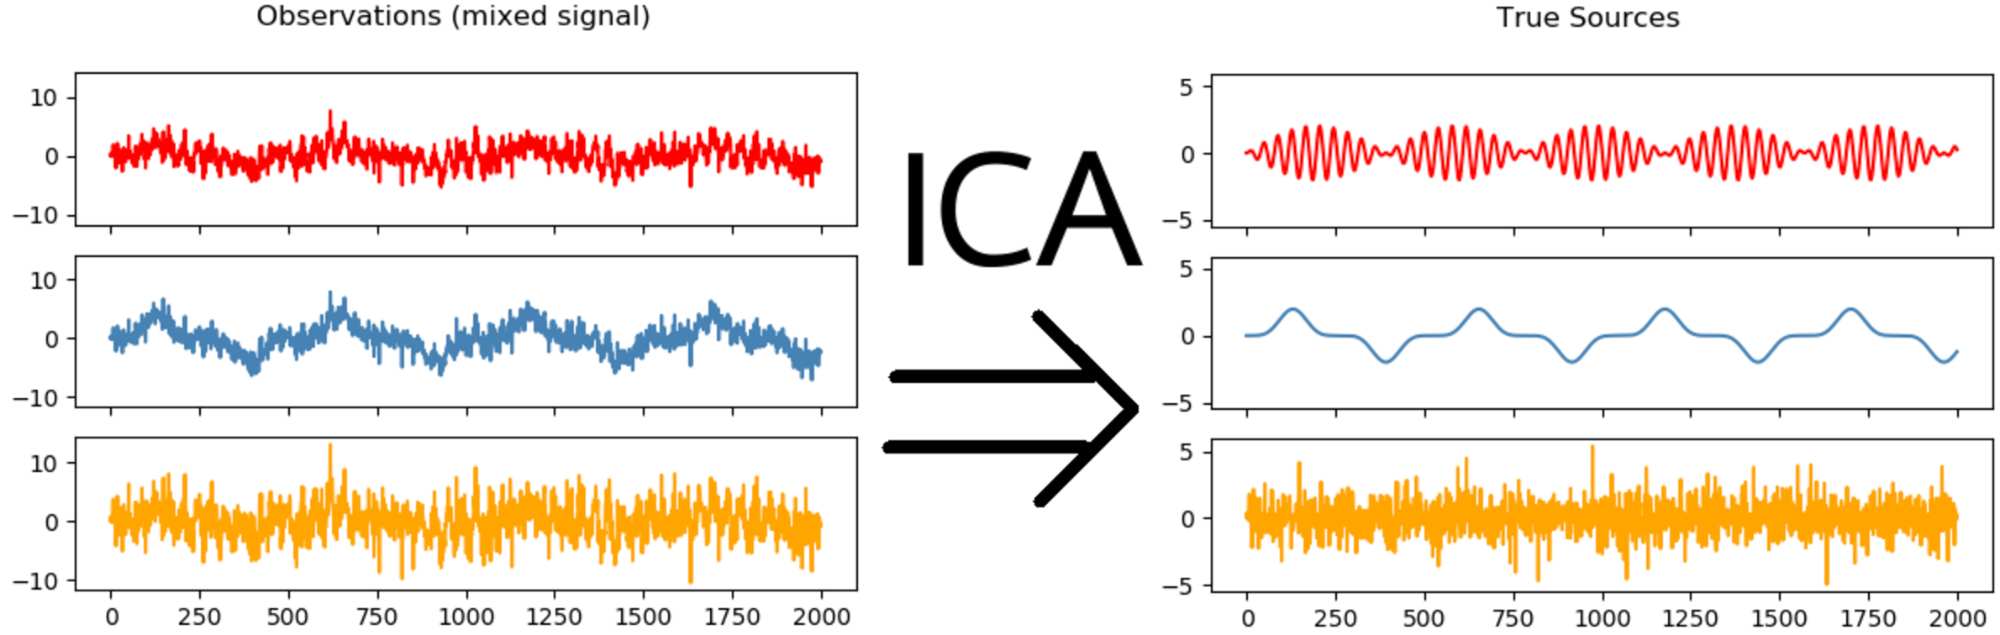
Independent Component Analysis (ICA)
ICA is a computational technique used in signal processing
to separate a multivariate signal into independent components. In EEG preprocessing, ICA can isolate and
remove noise, such as artefacts caused by eye blinks or muscle movement, improving the signal quality.
-
Independent Component Analysis (ICA)
So the usual process would be:
- (1) Signal Acquisition: Data from the Muse 2 headband is streamed using protocols such as LSL or OSC. EEG signals are time-series data with frequencies ranging from 0.5 Hz to 100 Hz.
- (2) Noise Filtering: Band-pass filtering (e.g., 1–50 Hz) and notch filtering (e.g., at 50 or 60 Hz) are applied to remove external noise and physiological artefacts like eye blinks and muscle movements.
- (3) Independent Component Analysis (ICA): ICA separates EEG signals into independent components, isolating and removing noise sources before recomposing clean data.
- (4) Epoching and Segmentation: EEG data is divided into time-locked epochs linked to specific events or stimuli for targeted analysis.
- (5) Feature Extraction: Power spectral density (PSD) analysis and time-frequency transforms (e.g., wavelets or STFT) are used to study brainwave activity across Delta, Theta, Alpha, Beta, and Gamma bands.
- (6) Validation and Visualisation: Visualisation tools like MNE and Matplotlib confirm data quality and preprocessing effectiveness, with real-time tools like MuseLSL aiding in live checks.
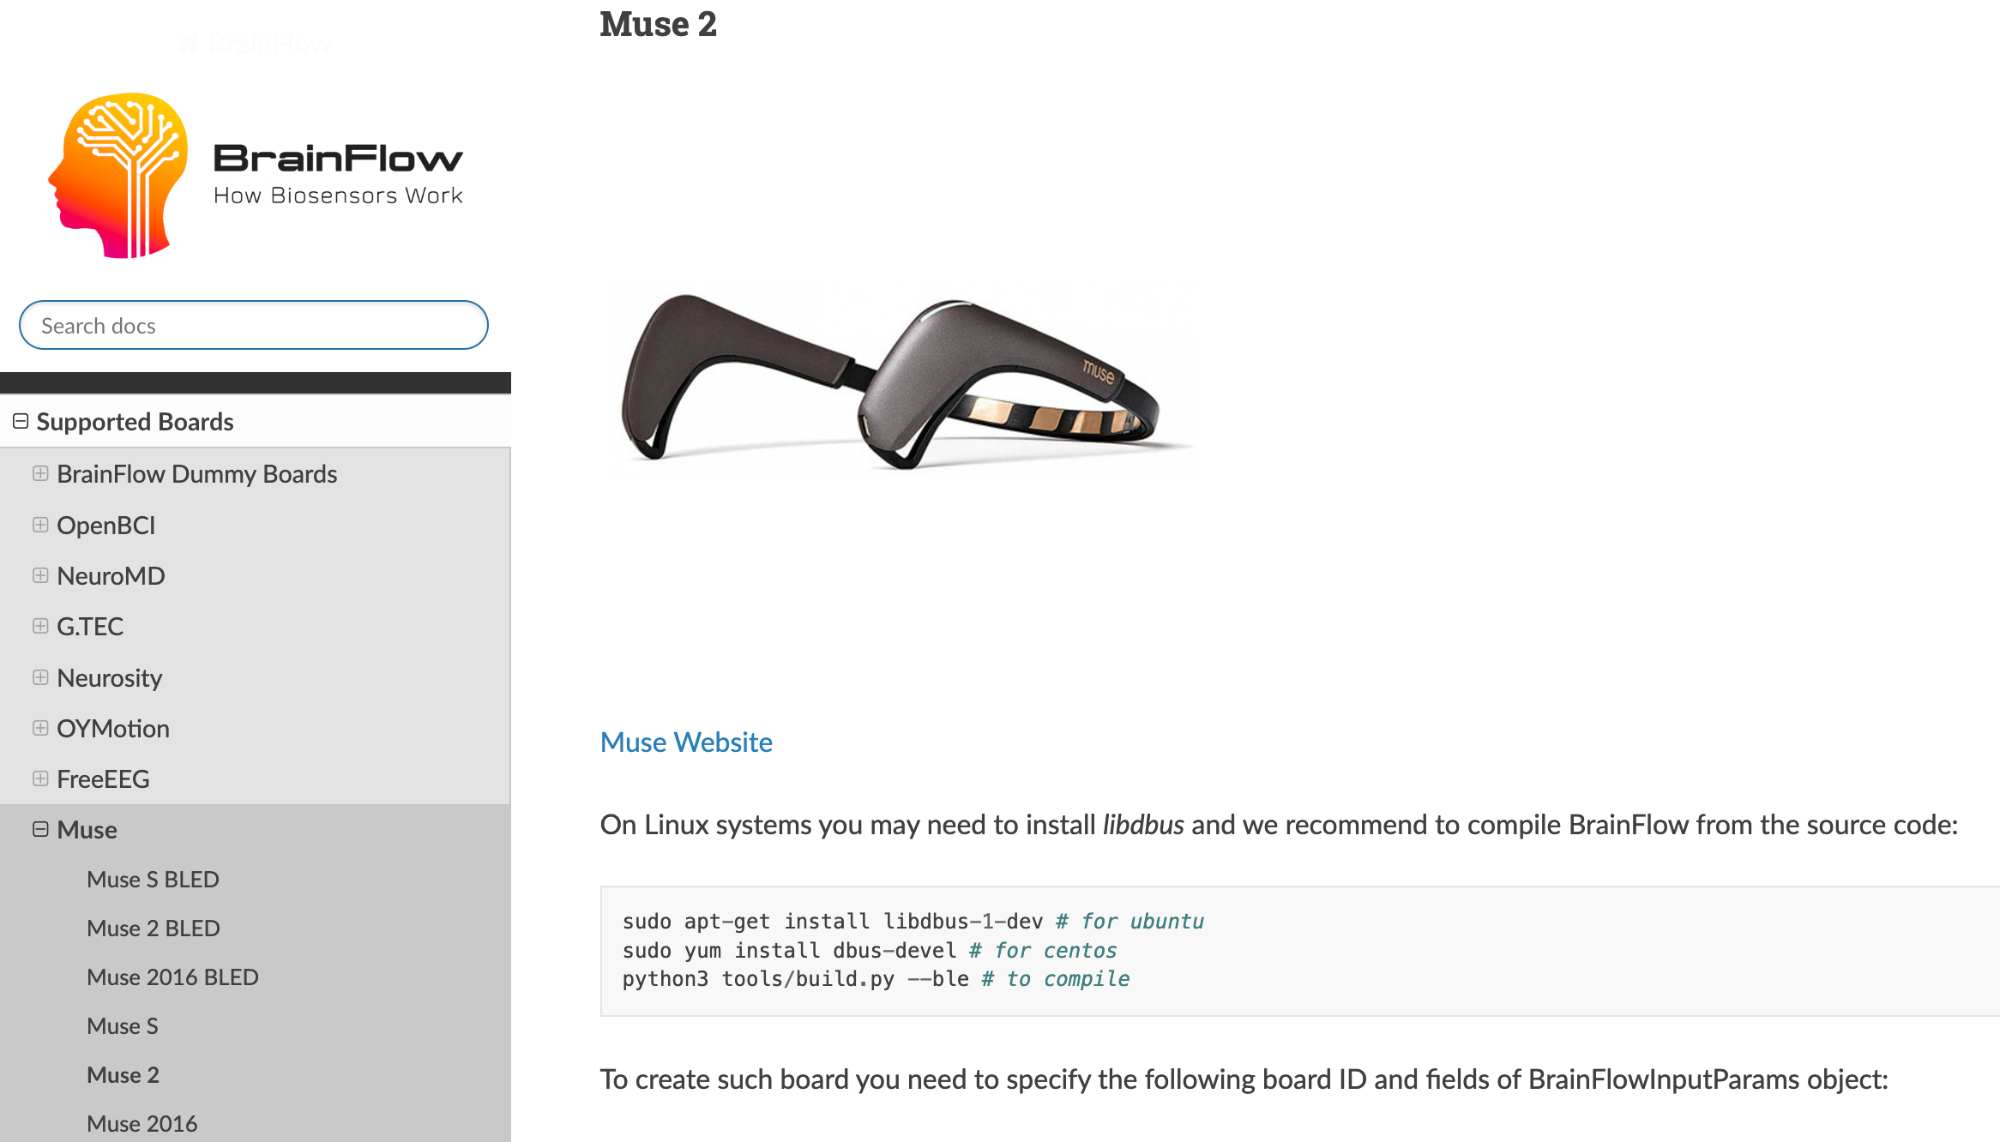
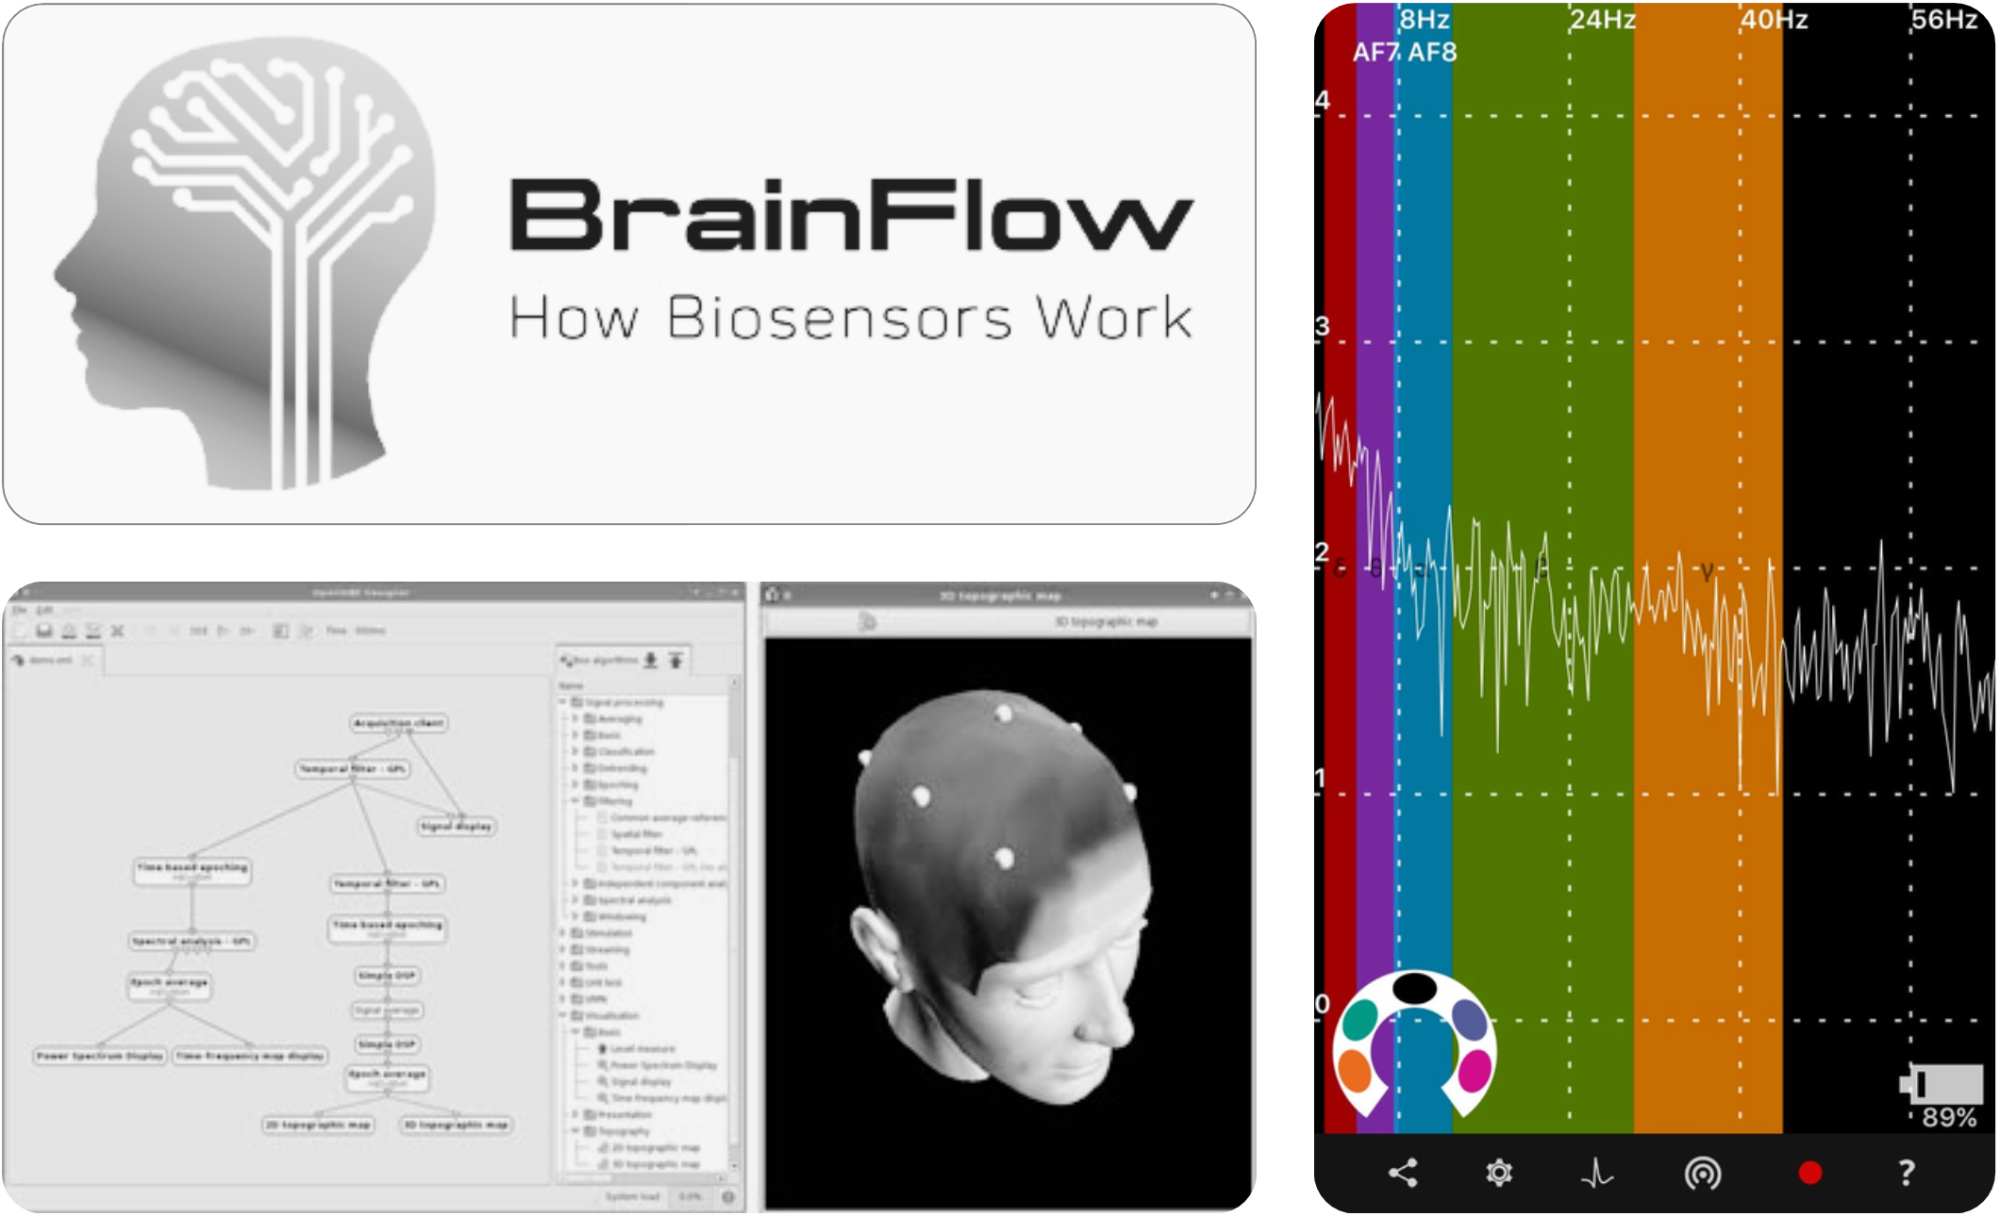
BrainFlow
In the technical aspect, the main challenge has been preprocessing my EEG data. I need to filter out noise to analyse the data more accurately and better understand the user’s mental states when interacting with the interface. Since the official software for my EEG device is currently unavailable, I’ve been experimenting with a Python library called BrainFlow. I’ve successfully established a direct connection to the EEG headband, which has improved the connection’s speed and stability. However, the data quality still needs improvement, as it is noisier than before.
-
Python library: BrainFlow
-
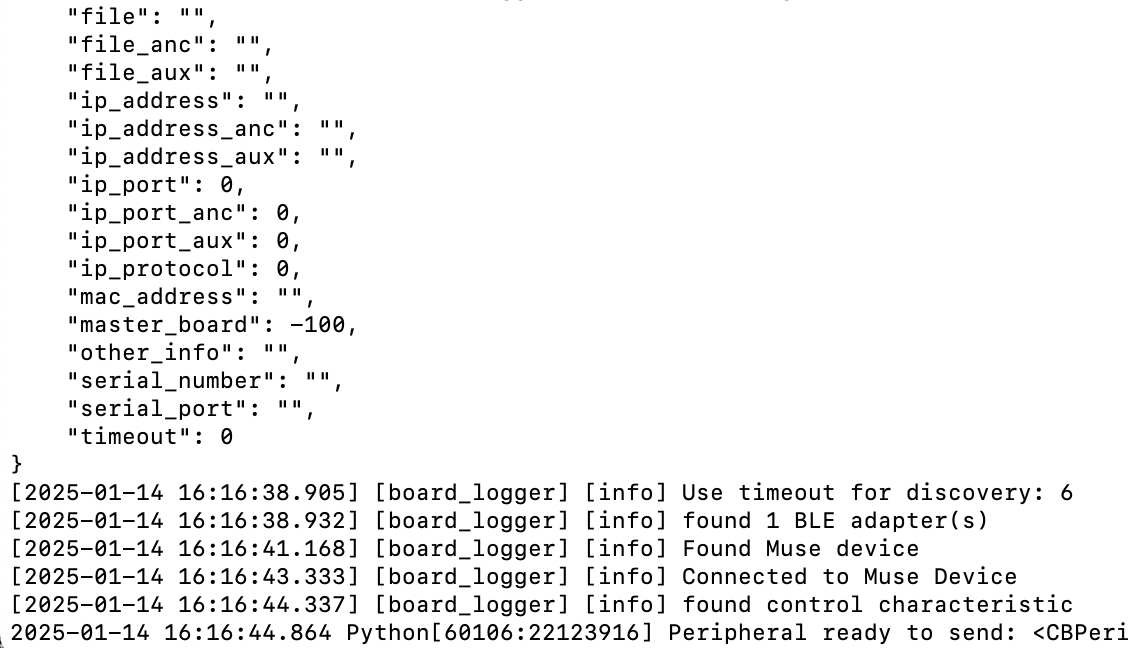
Connecting the headband
-
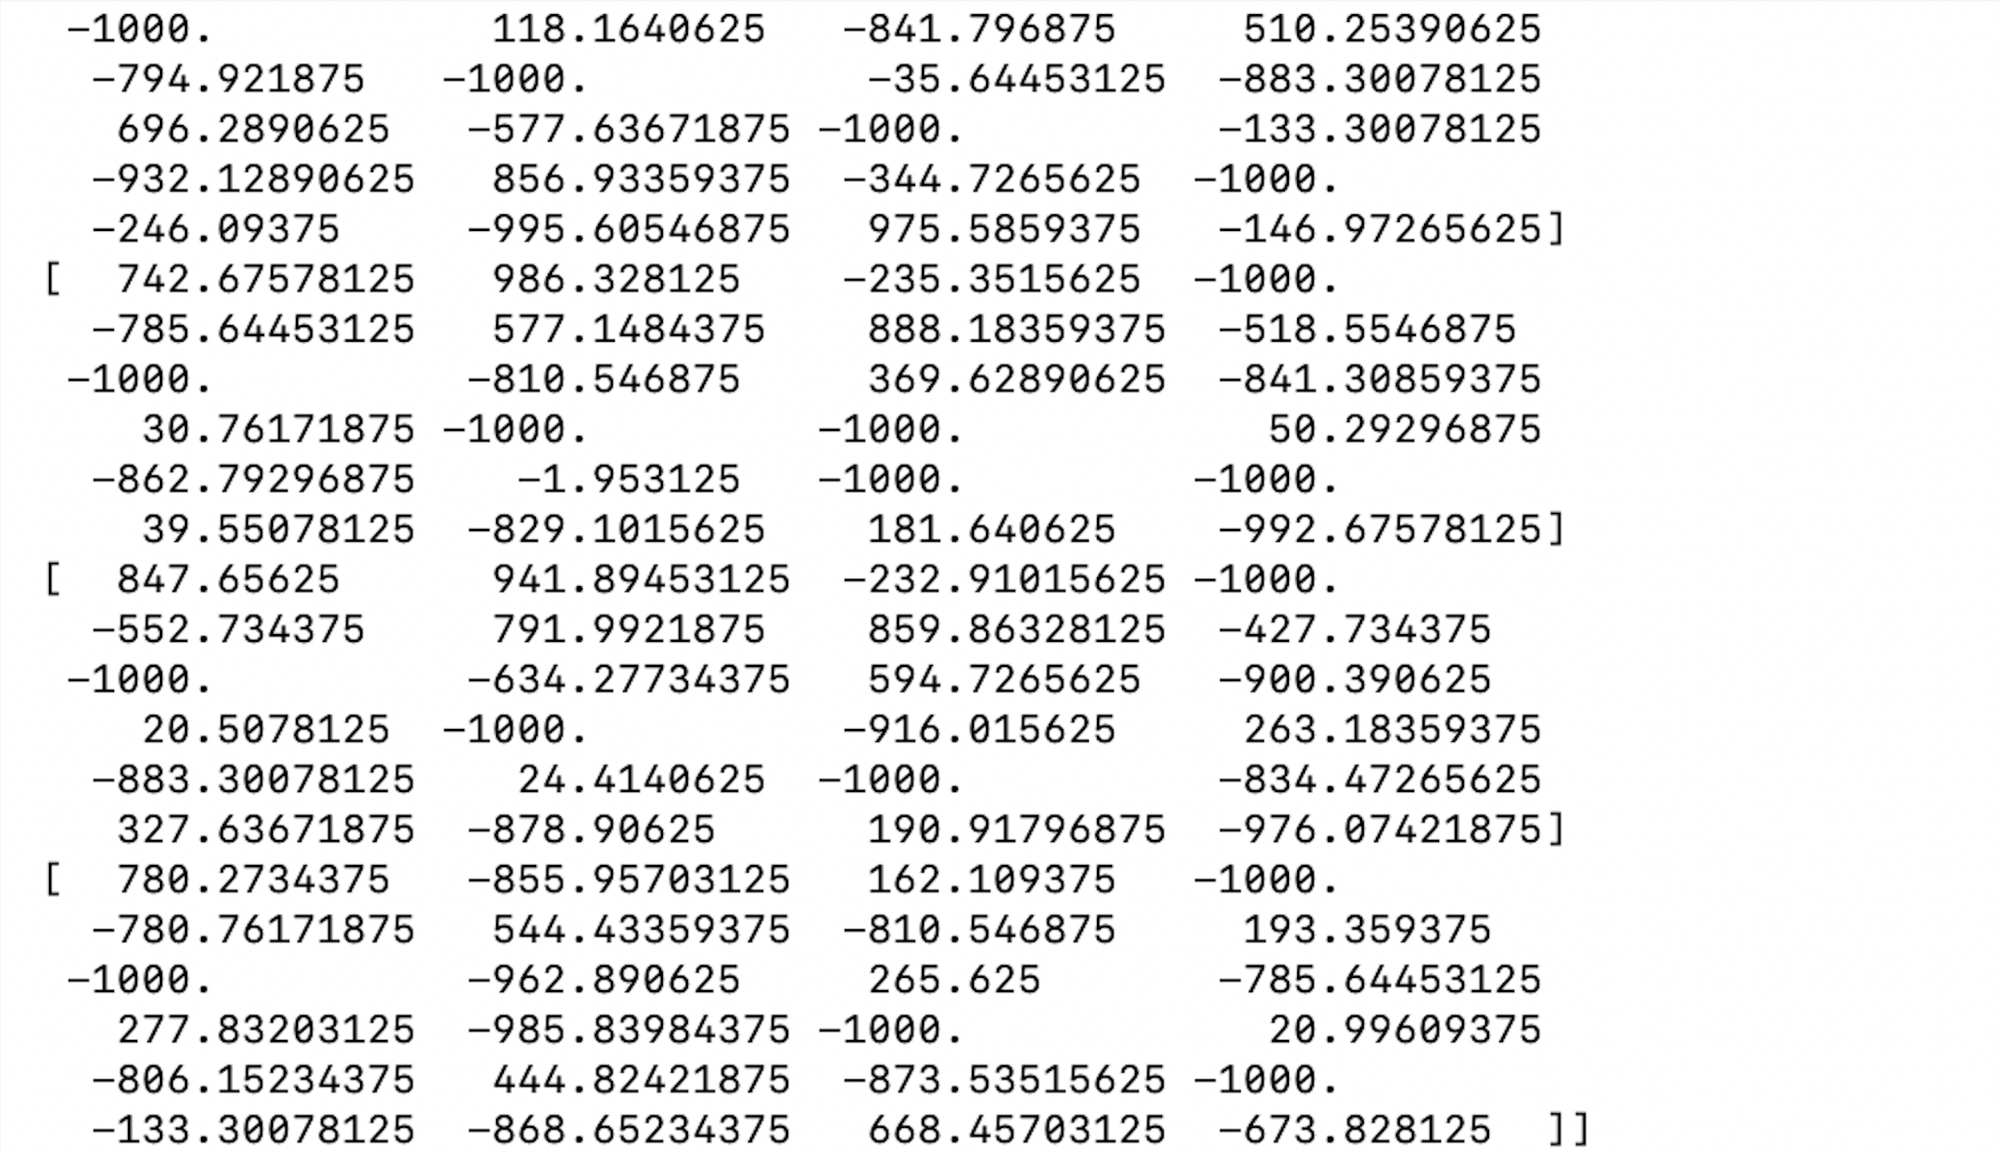
Raw signals
-
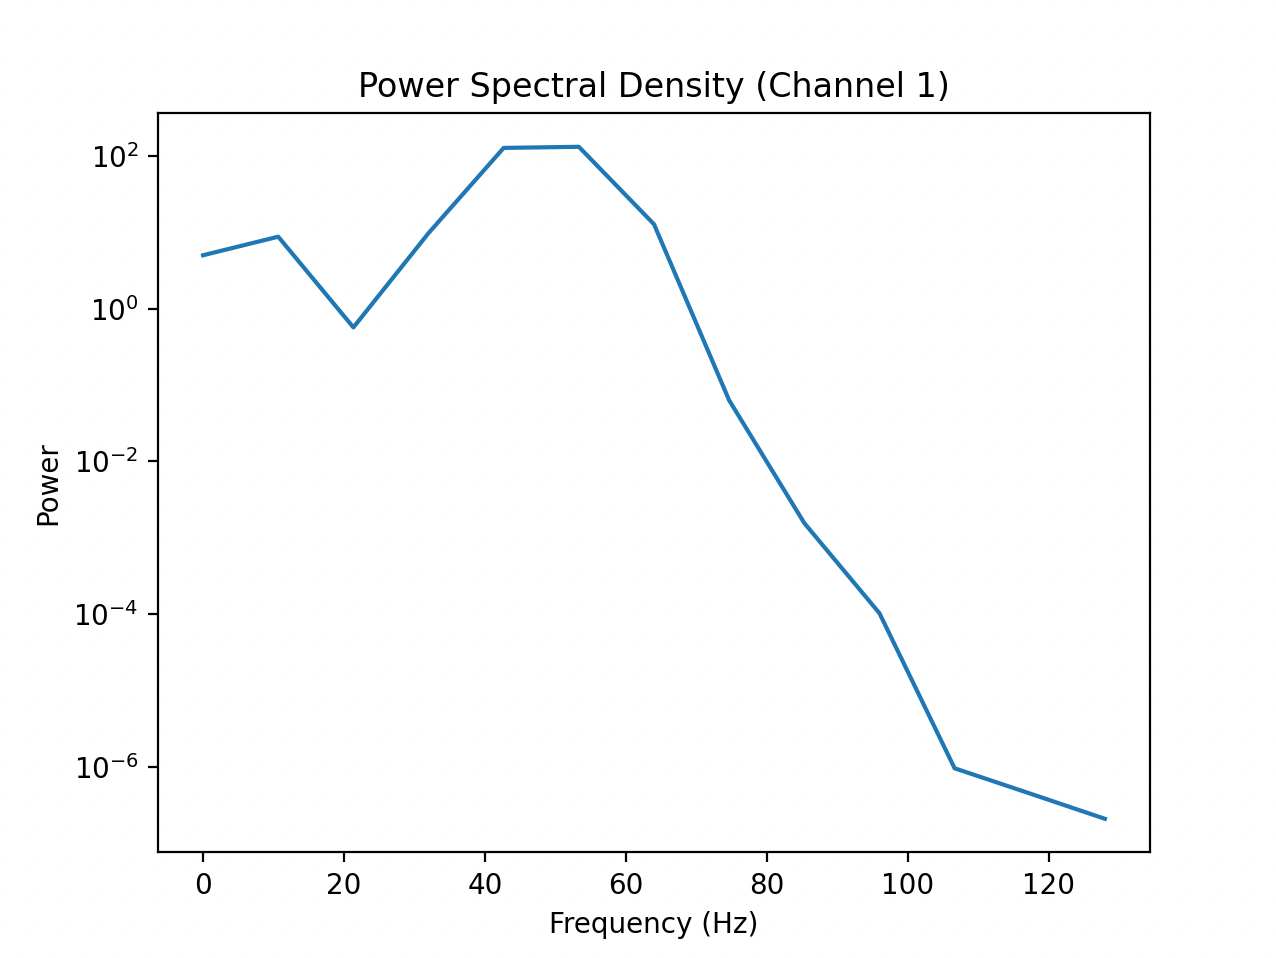
Power Spectral Density (PSD) plot
This is the Power Spectral Density plot of the first EEG channel. The single line represents the power, or signal strength, of different frequencies in the data from that channel. Currently, my code is written to calculate and plot the PSD only for the first EEG channel (eeg_data[0]).
- Frequency (x-axis): This shows the range of frequencies in the EEG signal. For example, alpha waves are around 8–12 Hz, and beta waves are around 13–30 Hz.
- Power (y-axis): This shows how strong the signal is at each frequency. Higher peaks mean there is more activity at that frequency.
-
Options for pre-processing
For some reason, when I tried adding different noise filtering methods in the BrainFlow library and incorporating components like ICA, the data stopped showing up. If I cannot find a solution to this, I’m also considering OpenViBE, but it doesn’t run on a Mac. My current goal is to have everything calibrated and functioning properly by the end of week two so that I can proceed with user testing.
If BrainFlow doesn’t work out, I have the option of using MindMonitor, a mobile app that manages the data. While it still has some noise, most research papers on BCIs for creative use that I’ve read rely on this app. This will serve as my safety net if the Python approach doesn’t show significant improvement by the end of next week.
ADDITIONAL COMPONENT
-
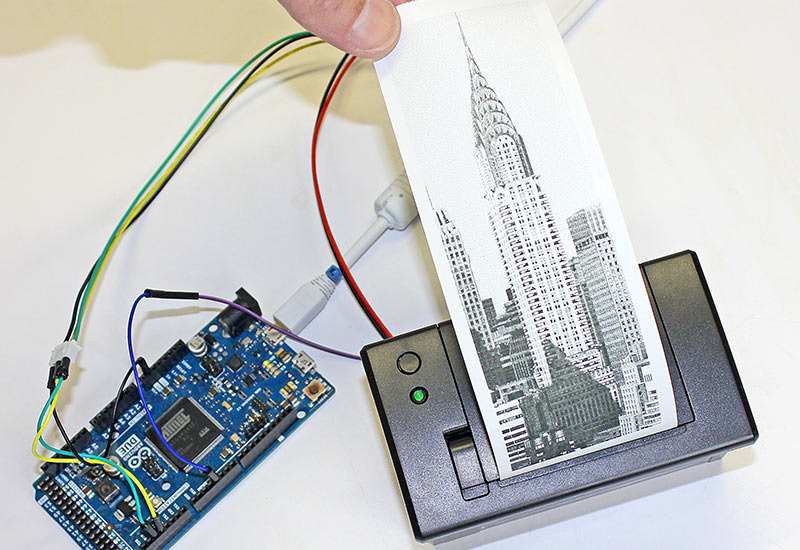
Thermal printer for bitmap image output
For the development of the interface in semester 2, I worked on some additional components that I didn’t have time or resources for in the first semester. For example, I bought a thermal printer that can print bitmap images. The printer I used last semester could only print text, which limited what I could do with my prototypes. With this new one, I’m hoping to use those features in my final iteration. I’m also testing a new water pump model, but I’m still deciding whether it’s the right fit for my project.
Timeline
I made a timeline that outlines key milestones, purposely condensed so that there is more wiggle room in the future. In week 2, the processing of data will be implemented in the prototypes, and there will also be initial attempts at 3D printing.
Feedback from the user testing in week 3 will inform software updates to refine prototype functionality by week 7. Hardware development, including sketching, 3D modeling, printing, and laser cutting, will be completed by week 10 for the final prototypes.
-
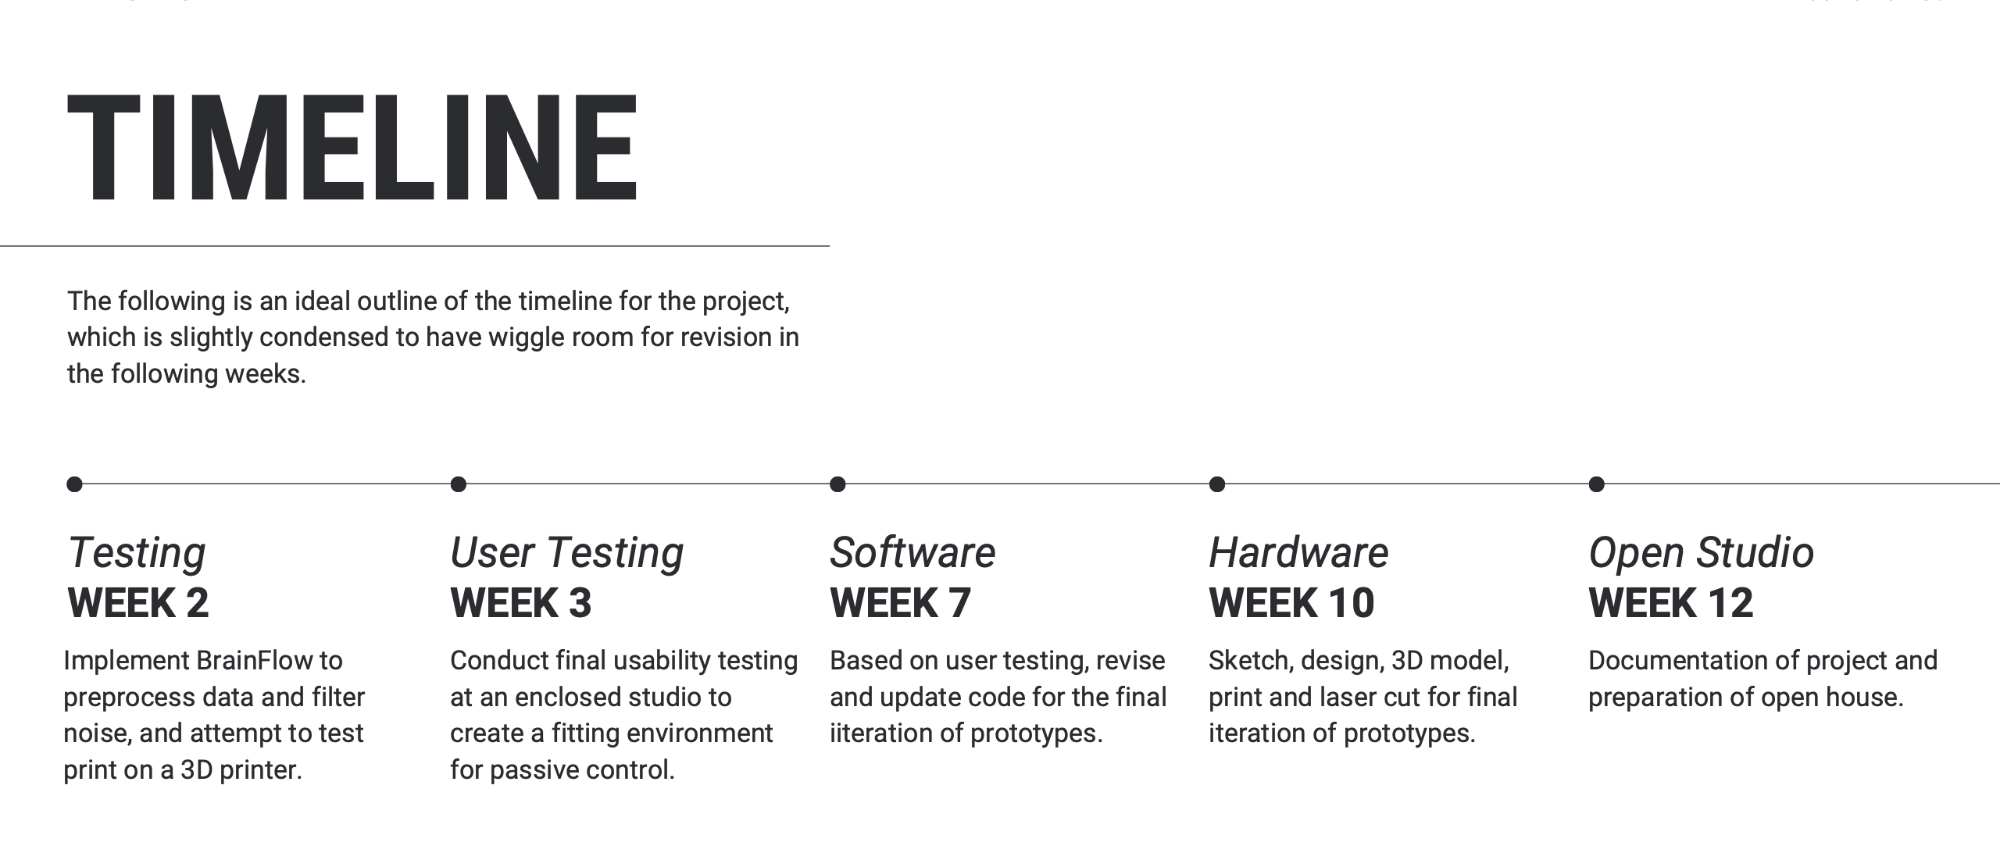
Project timeline and milestone planning