06
Making with EEG 2:
3 Tasks in Progress
16.09.2024 ~ 22.09.2024
Feedback
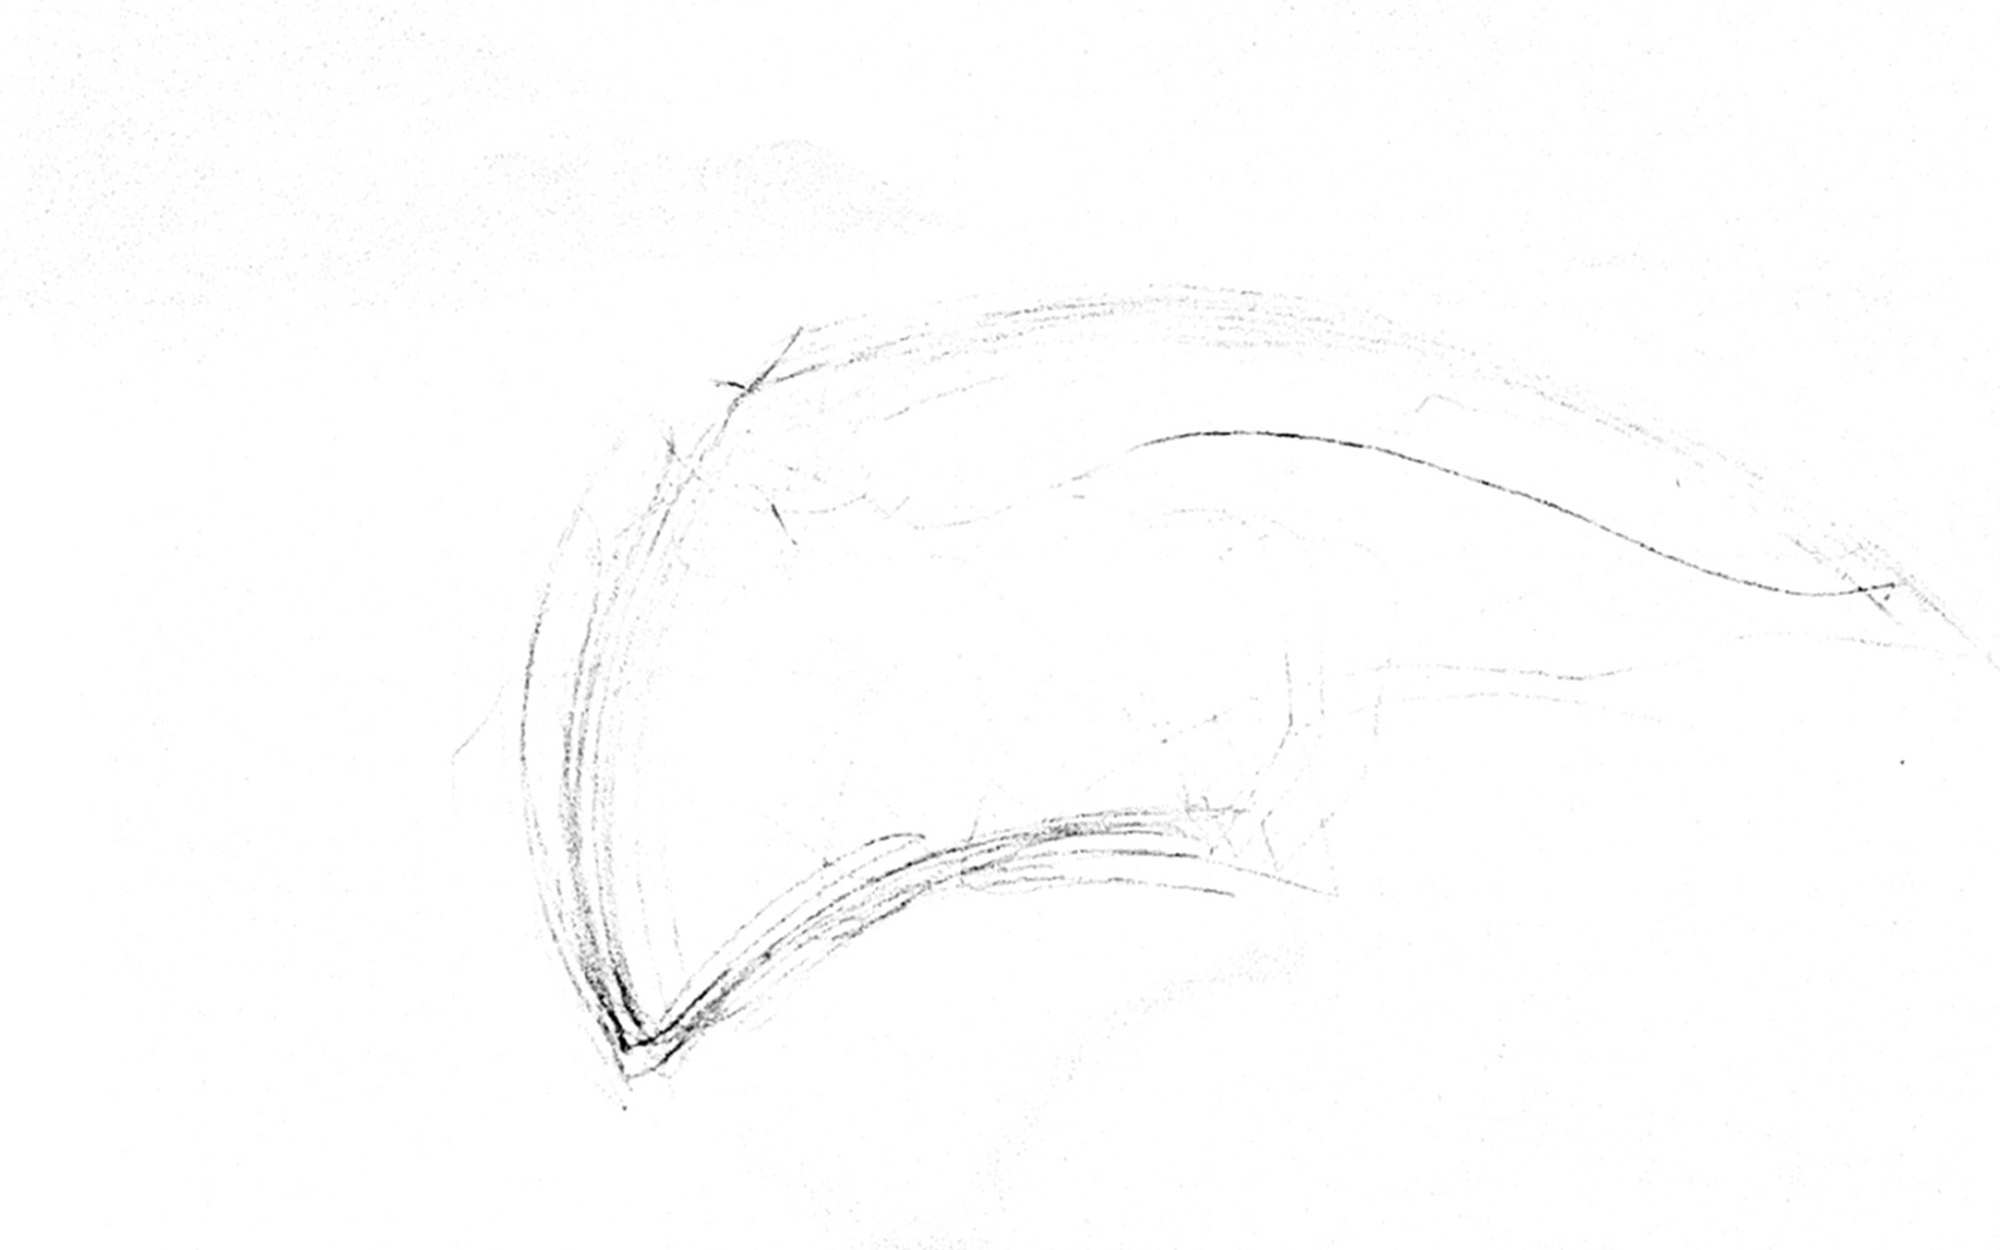
Task 1: Drawing Machine
- Create video documentation for each step of the project.
- Include a teaser to explain the concept and the making process.
- Document what works and what doesn’t work in the process.
Task 2: EEG to Screen
- Analyse the data collected and present it as a graph for clarity.
- Interpret the data and display it in a simple visual language.
- Use diagrams to show the function of the device.
Task 3: Gu-rum
- Take a systematic approach to understanding each component.
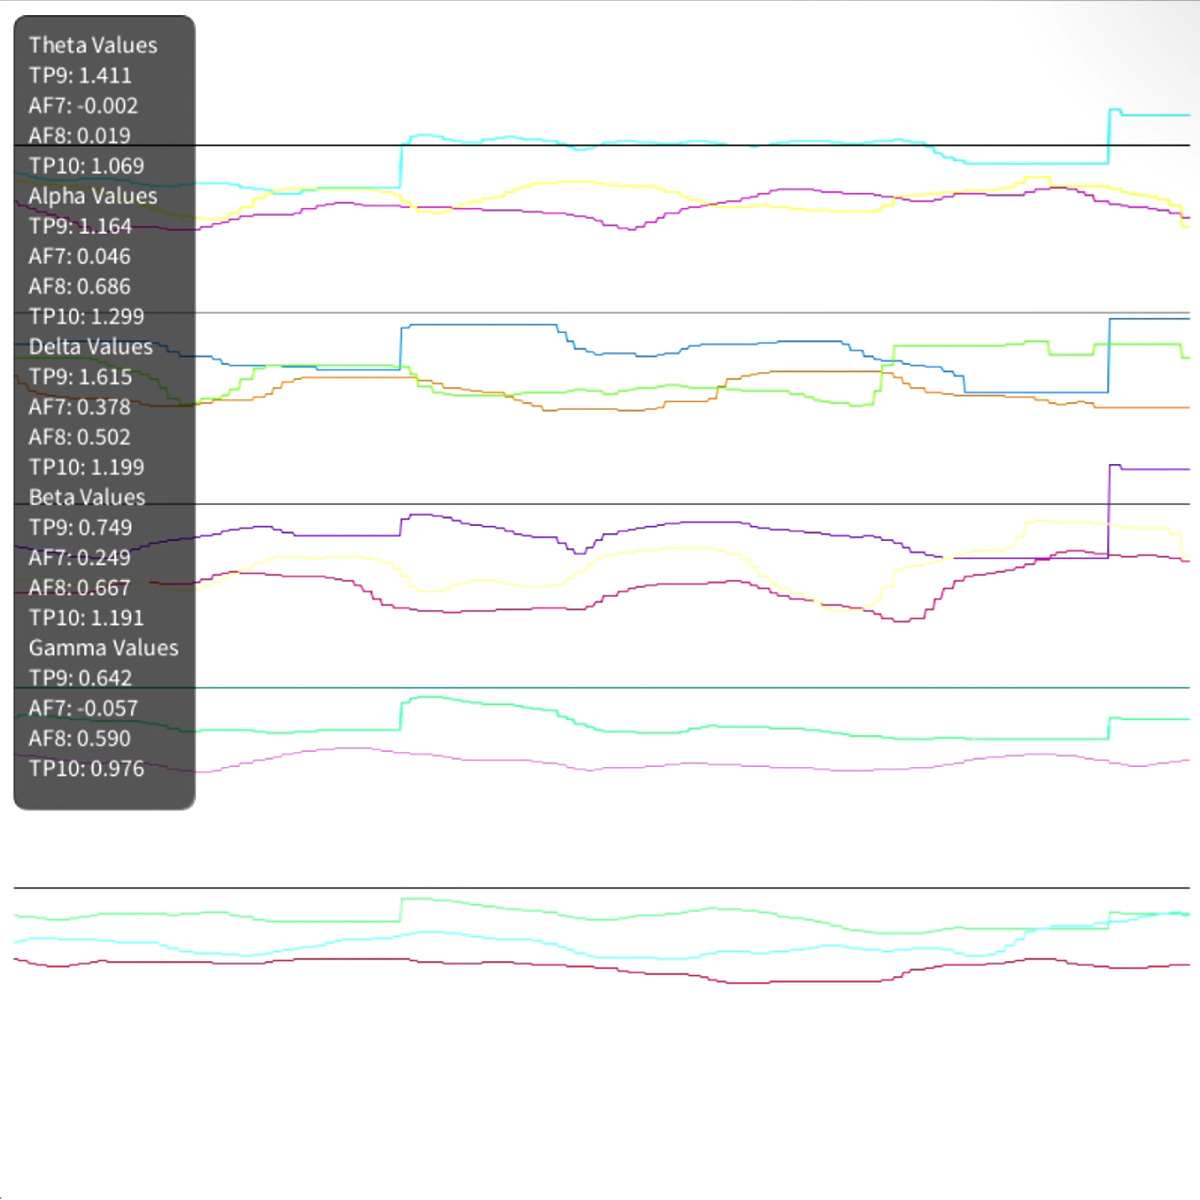
Data Analysis
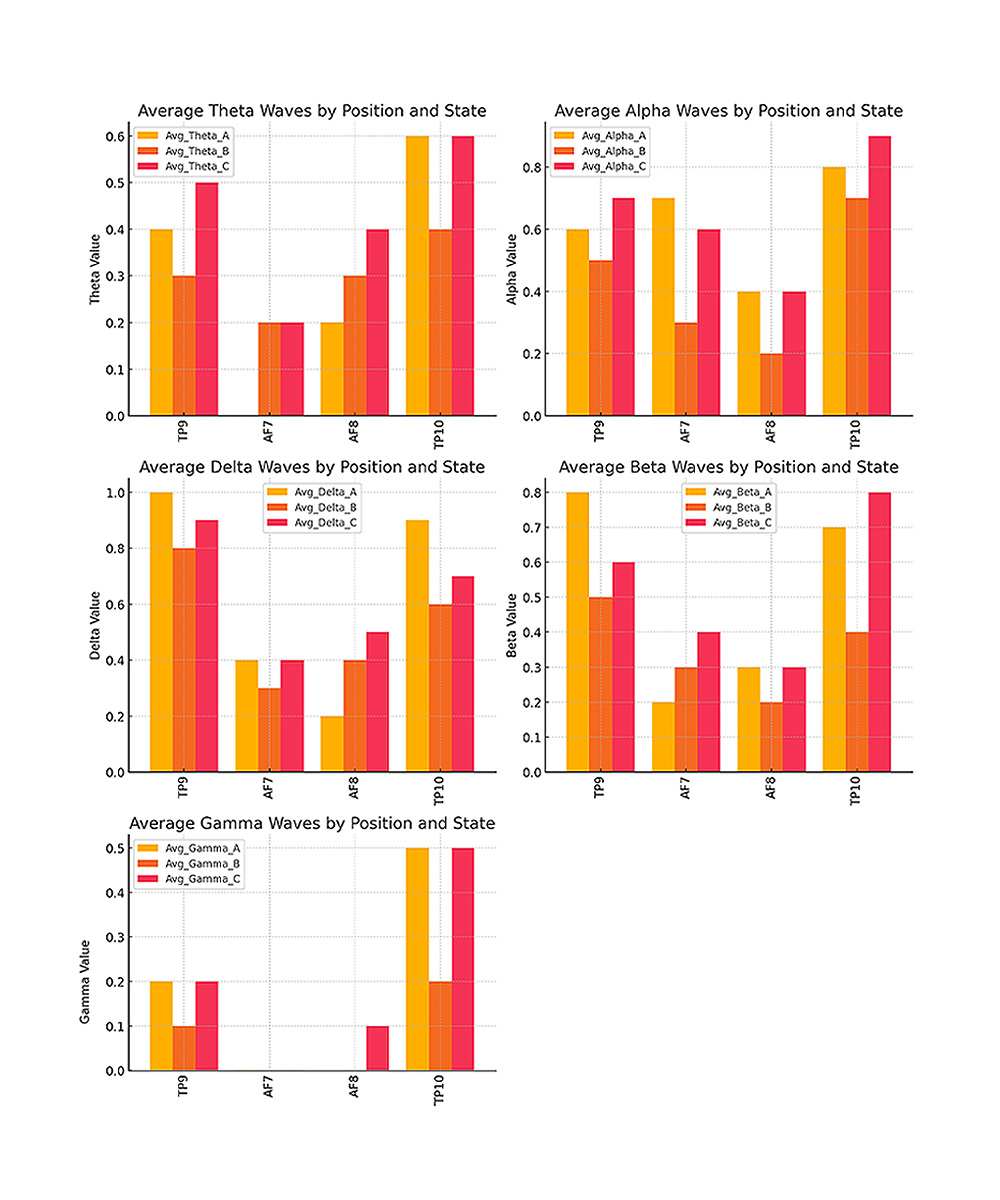
I chose to go with all 20 data points for the data analysis, to fully understand what possible data could be used. And any other dataset can be calculated anyways.
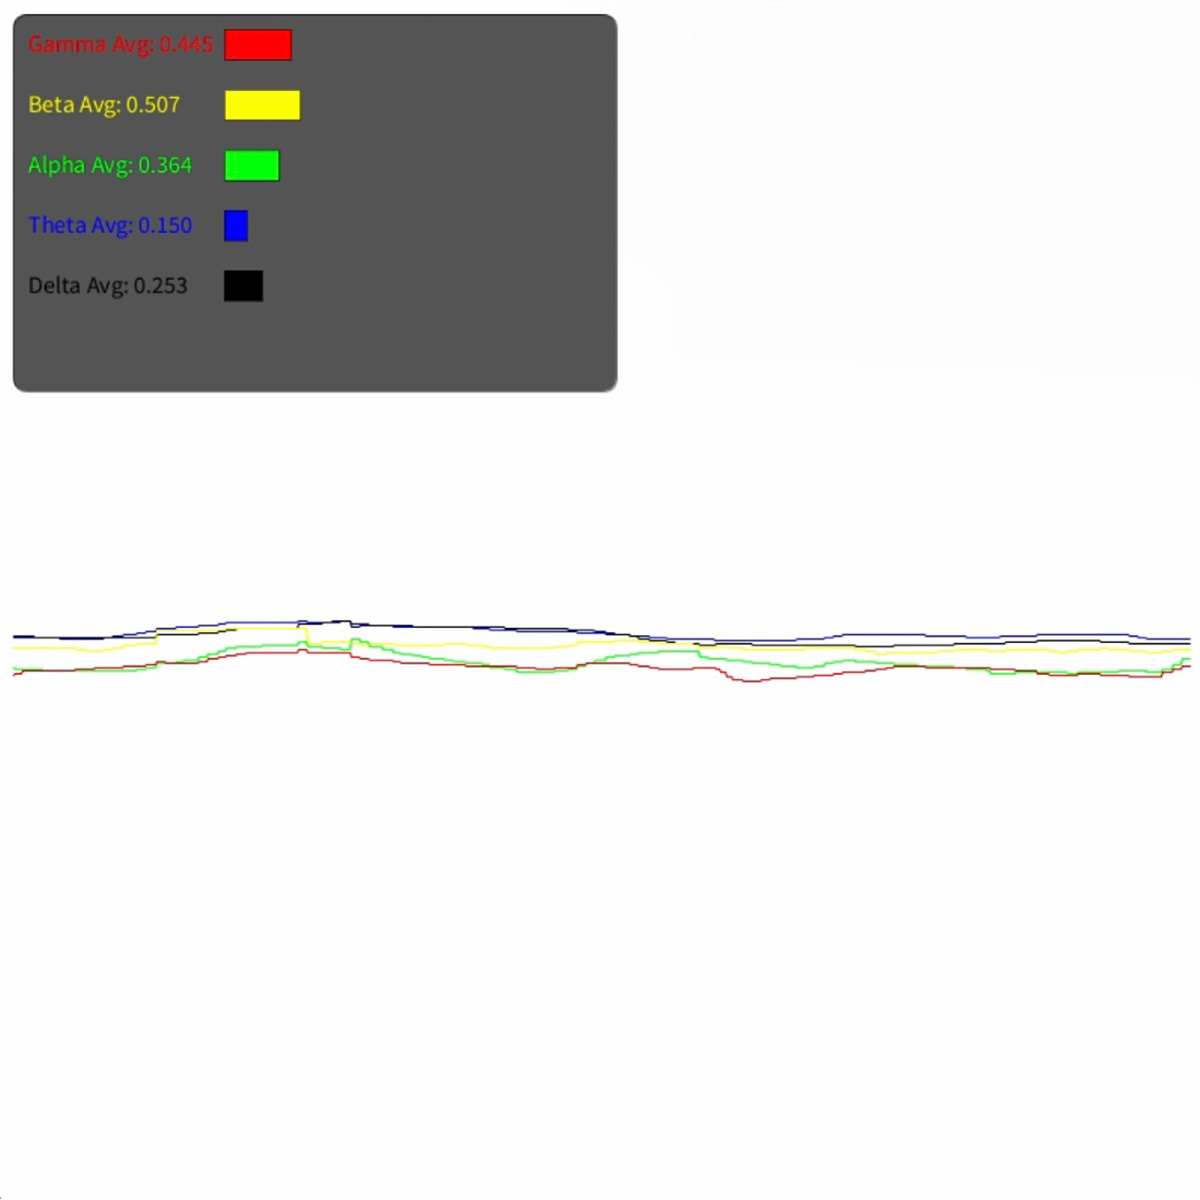
These datasets were graphed into visuals for better visualisation of this brainwave activity and its respective correlation to the mental state. Outputs based on these are the basis for the data visualisation and analysis.
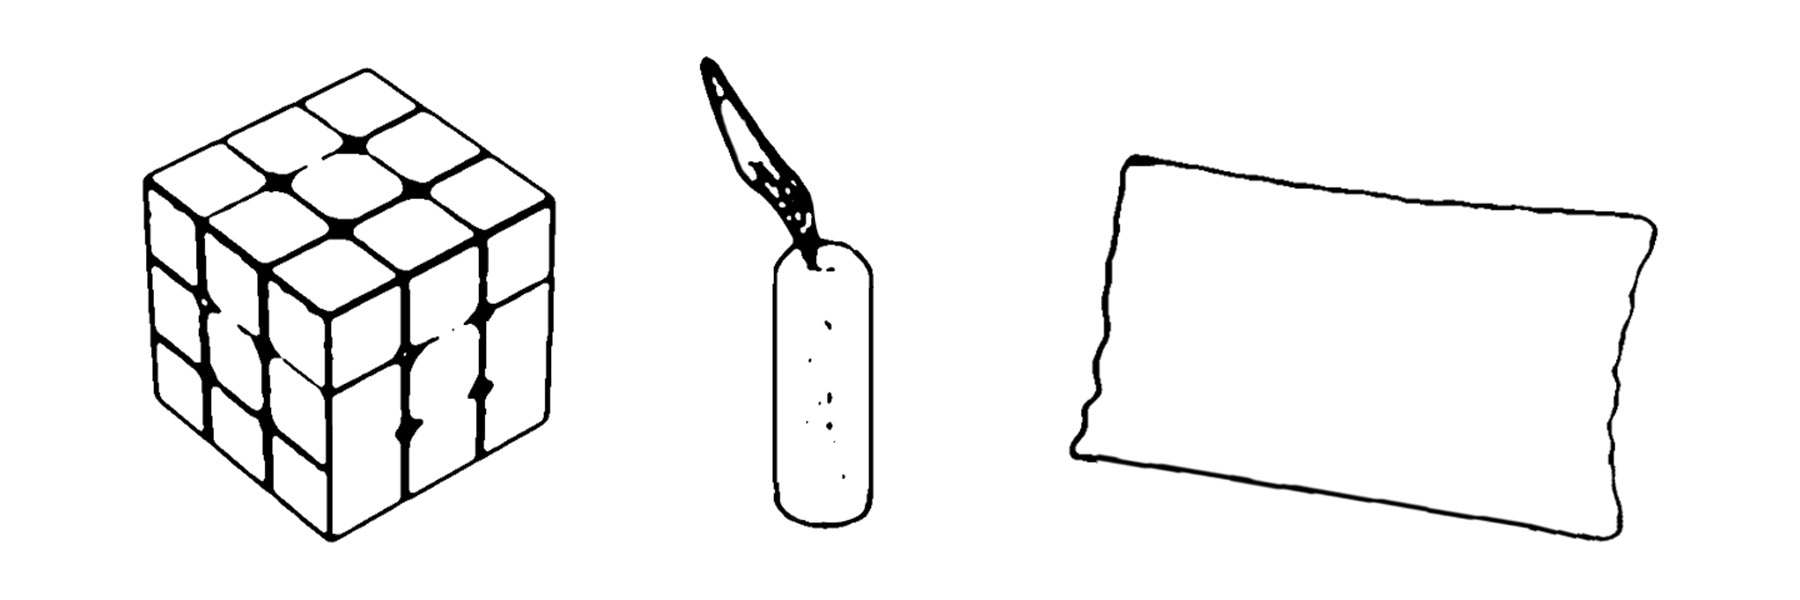
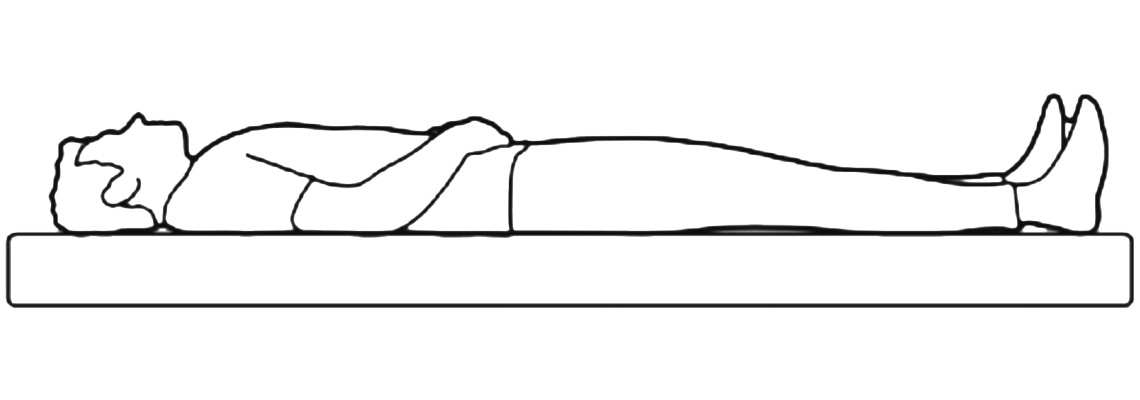
I recorded myself in three different scenarios to measure my brain activity: first while solving a Rubik's cube, second while meditating, and third while taking a nap.
To minimise noise in EEG readings, I ensured proper placement of the electrode with good skin contact and a secure fit (there are concerns for this in a dry environment, but the weather conditions of Singapore does not give me the luxury to worry about this), avoid muscle movements like jaw clenching, and reduce environmental interference by trying to limit nearby electronics.
Even when recording for the focused state, I tried to lie down straight, and tried to minimise any movement outside of my fingers. Also, in the future (not this time), I could use techniques like bandpass and notch filters to remove unwanted frequencies, and artifact removal algorithms to eliminate noise from movements.
I didn't have any strong expectations for how distinct the results would be, especially because I know that brainwaves can vary greatly between individuals. One of my friends, who conducts research for medical journals, mentioned that studies usually involve large sets of data points from many participants to understand EEG responses on average. This makes sense because individual brainwave patterns are unique and not fixed.
At first, there were unexpected results. For example, I had high levels of delta and theta waves while awake. Although it's not uncommon to have high theta waves during wakefulness, the fact that my delta wave activity was higher during wakefulness than while I was sleeping or meditating was unusual. Based on what I’ve read, this could be due to 'noise' in the EEG readings. Noise in EEG refers to unwanted signals that can come from things like muscle movement, blinking, or external interference, which can mask or distort the real brainwave data.
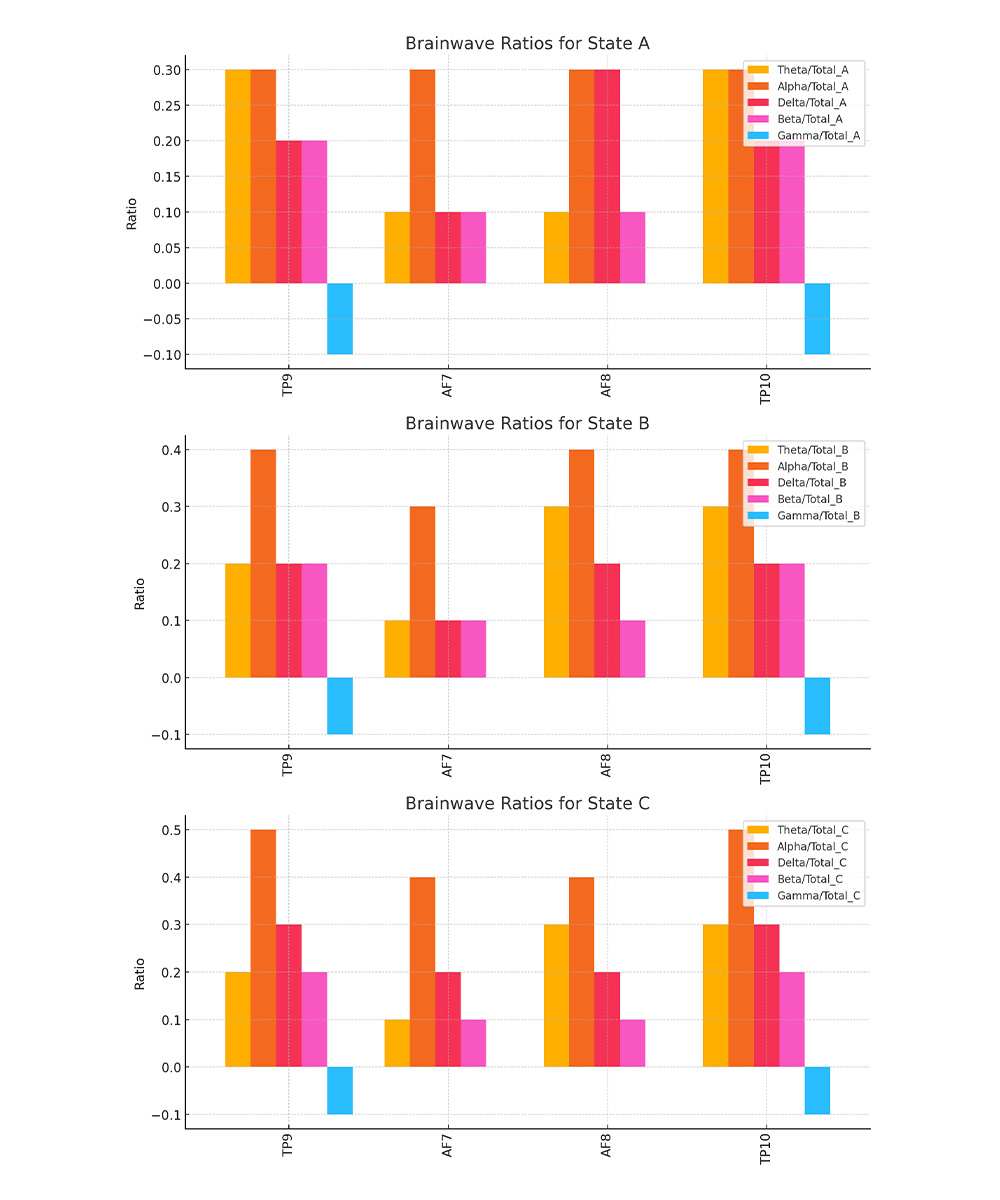
Since I hadn't yet calibrated the device to reduce noise, I had to find a way to analyze the data despite it being somewhat unstable and fluctuating. Instead of comparing the raw data, I decided to look at the ratios of brainwave types for each state. I figured that even if the overall high brainwave values in the awake state were caused by noise, like my eyes being open or some other interference, calculating the ratios could give a more accurate picture of the brainwave differences across states.
I am excited to do some user testing to see how idividuals might differ from each other through their brainwaves. Also, I am curious about how my brainwaves differ from the average person. TMI alert! I’ve been diagnosed with ADHD and OCD in childhood, and studies suggest that people with ADHD tend to produce more alpha and theta waves while awake, while those with anxiety or OCD often show higher levels of beta waves. This presents an interesting contradiction for me, as I wondered which condition might be influencing me more.
Task 1: EEG to Drawing
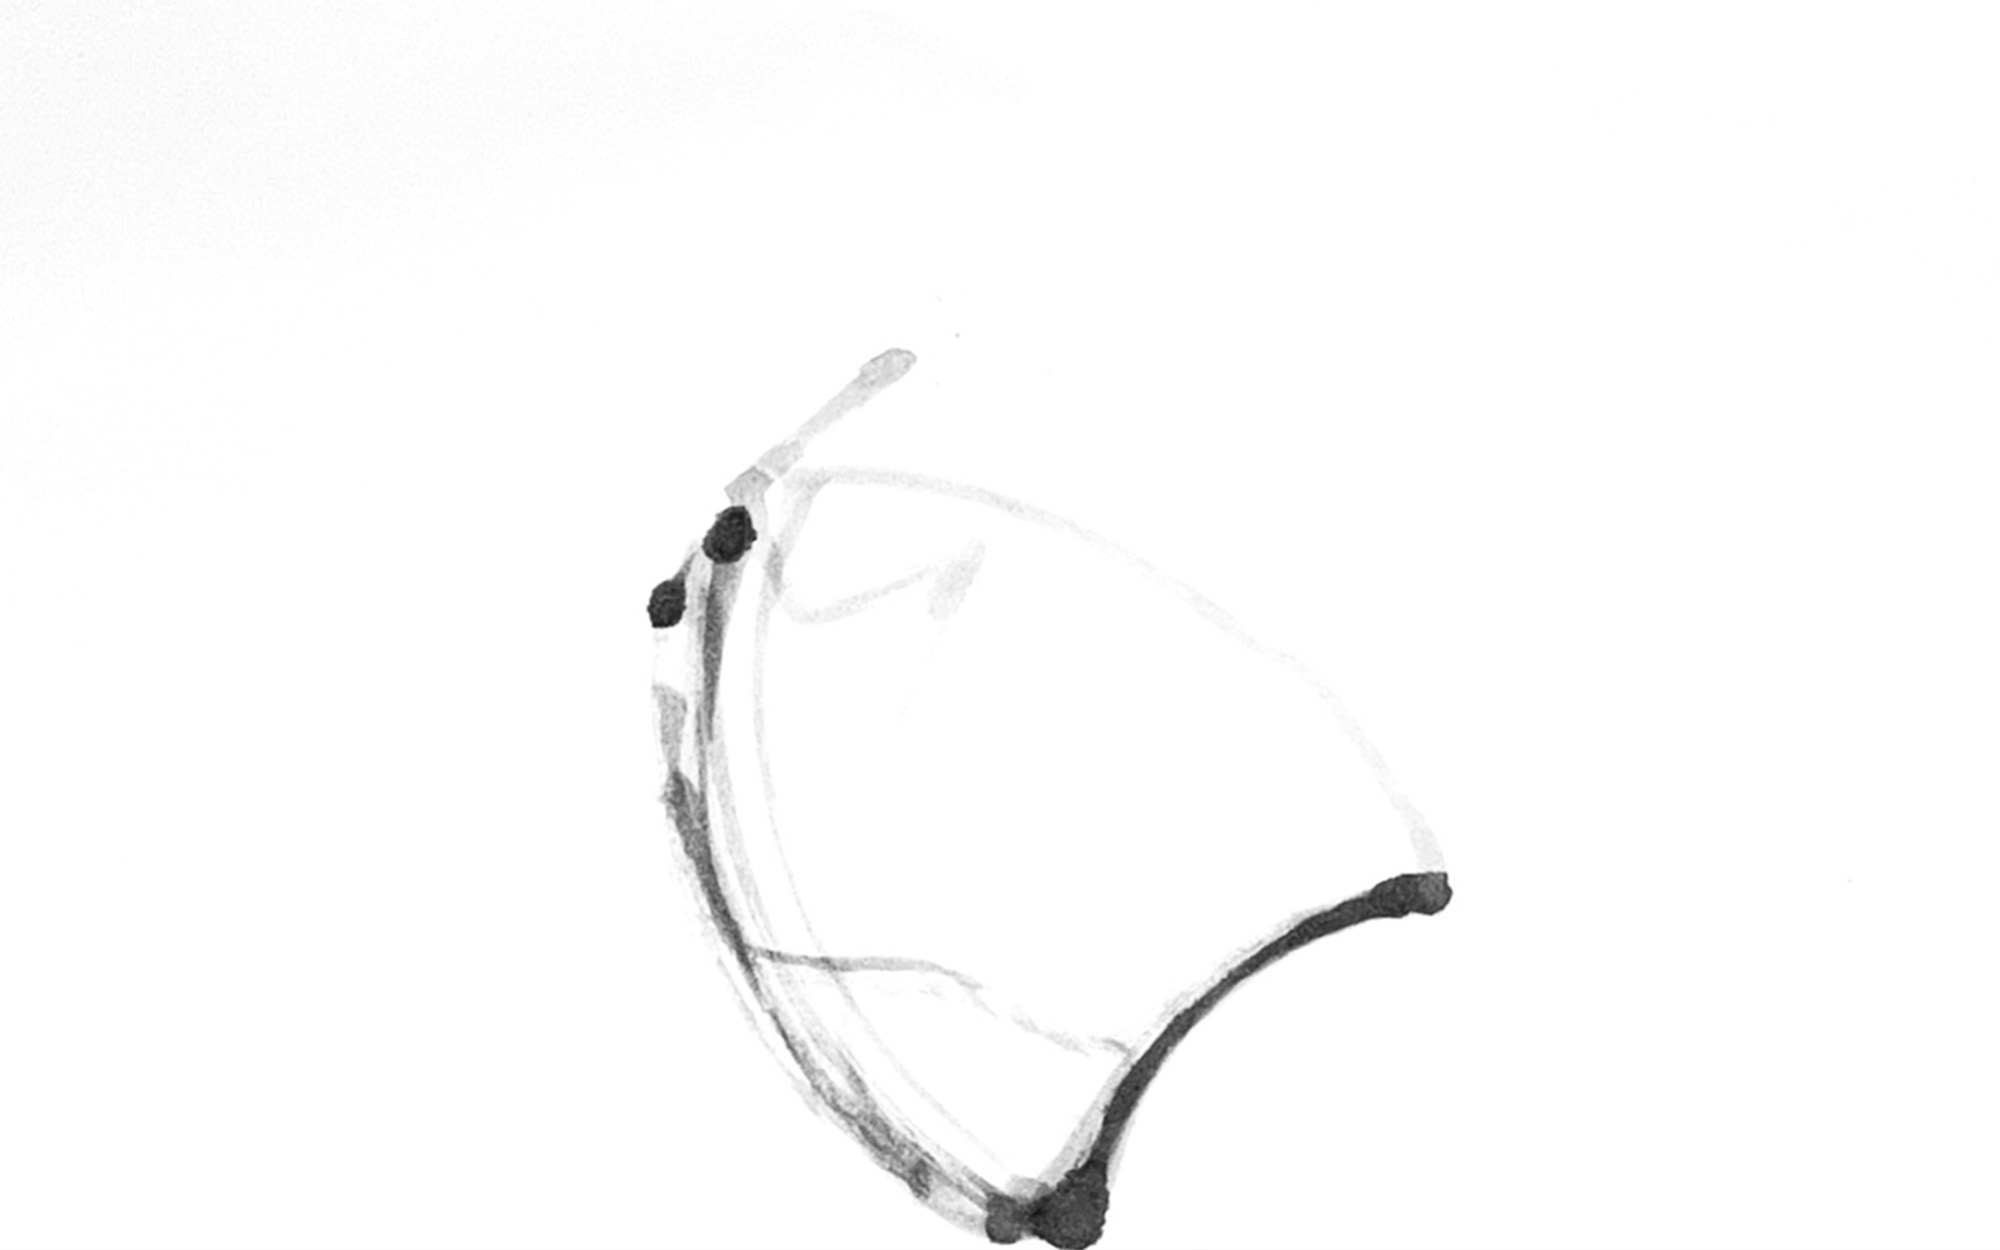
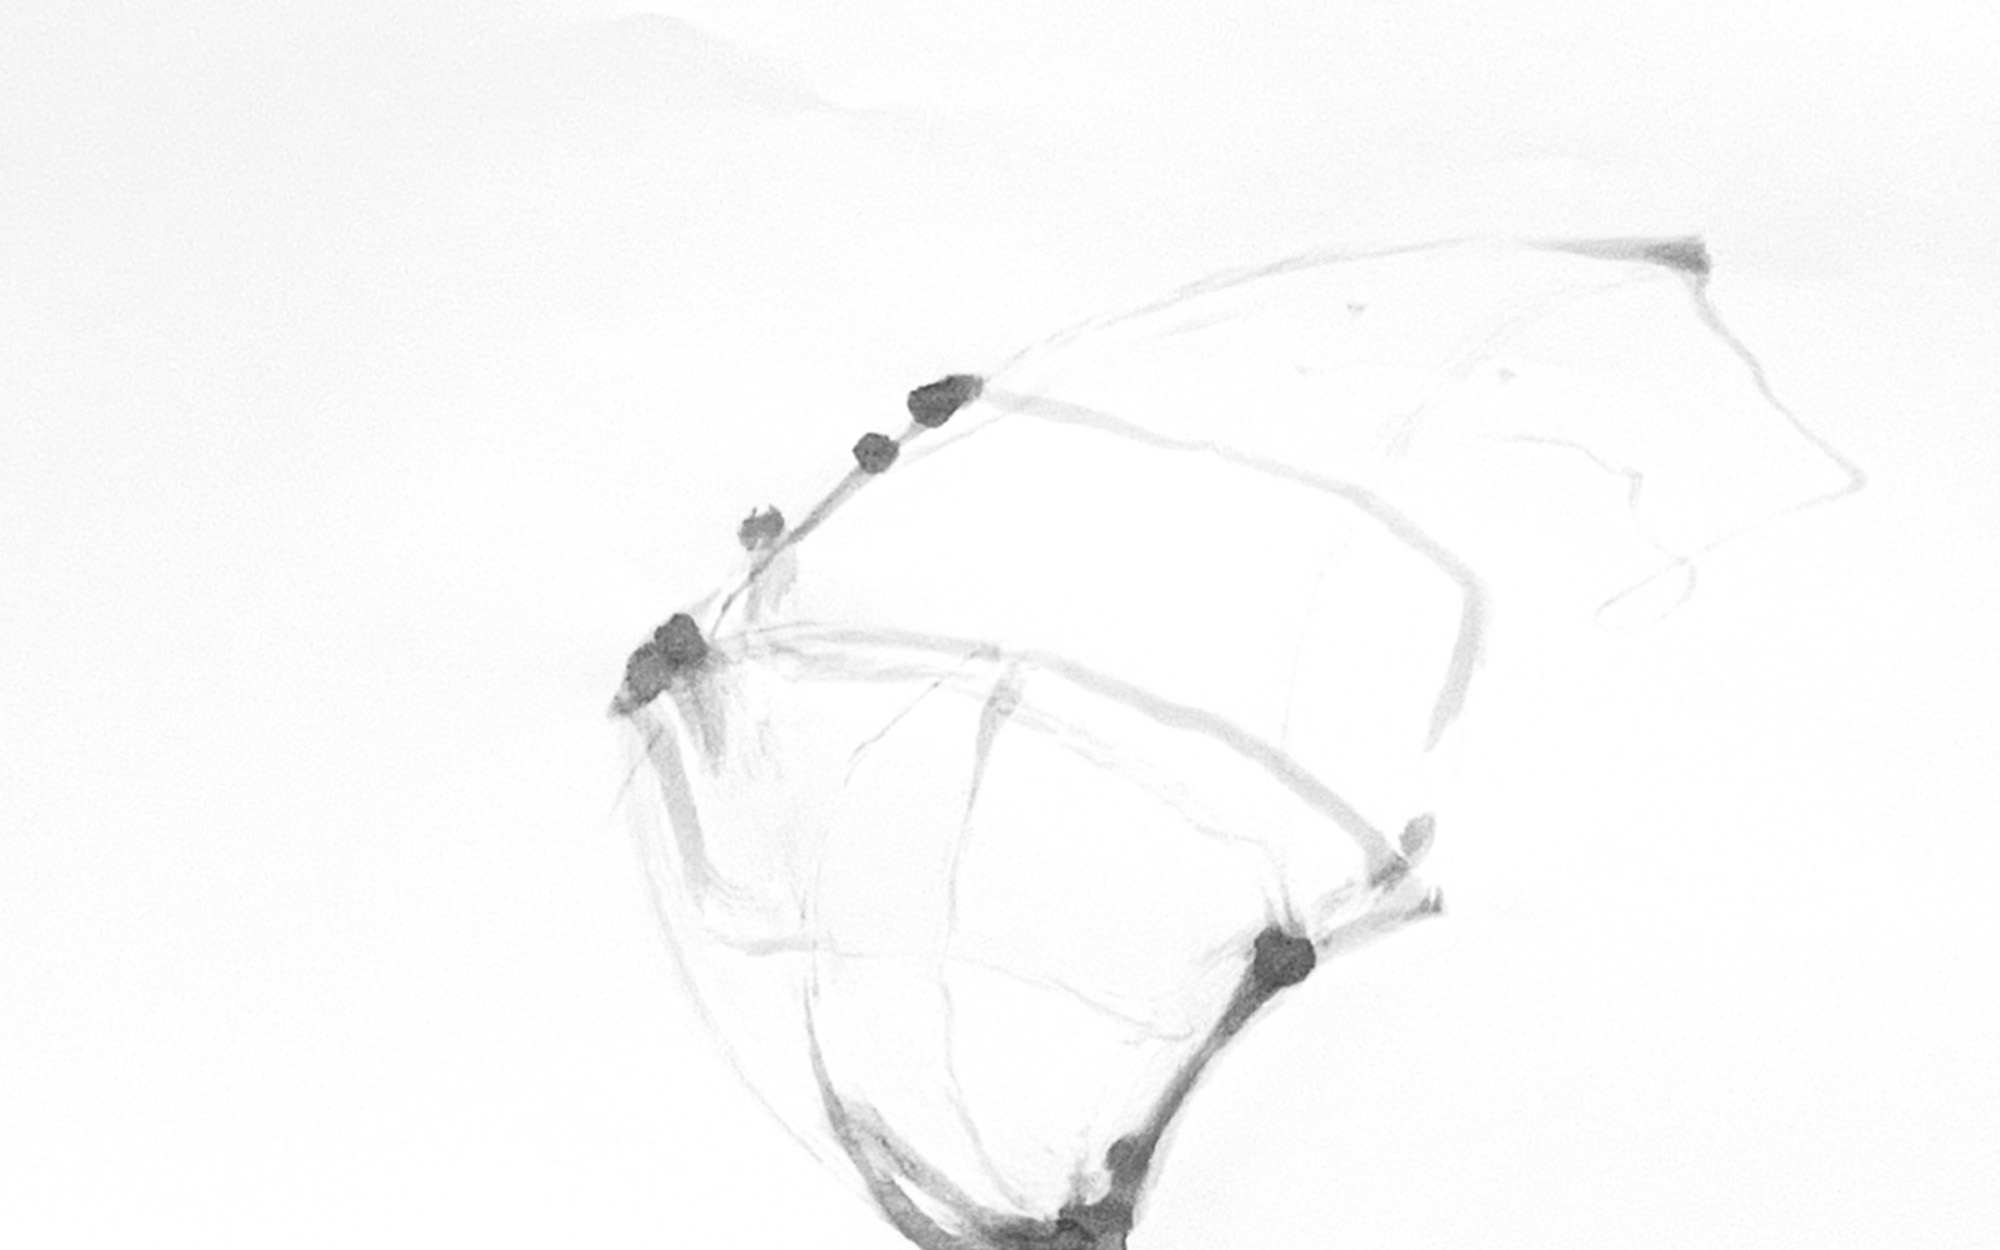
At first, I tried to use theta and beta waves to draw while I slept, but I realised that if I wanted to do user testing soon, it would be better to start with a conscious state. The alpha and beta waves were chosen as they are relatively of higher variance in the awakened state, representing the calm and focused state respectively.
I chose a brush for the drawing, since I wanted to try something other than a pen, and a pencil didn’t leave very distinct marks. With Alpha waves controlling the shoulder motor and Beta waves guiding the elbow motor, I felt like I could somewhat control the machine’s movement by focusing their attention, a possible sense, or illusion, of agency. A good exercise to start exploring how brainwave activity could be translated into analogue drawings, making the machine a tangible extension of mental processes. User testing to be continued.
Task 2: EEG to Screen Output
Following the feedback, my first course of action in the second experiment was to work on the visualization of the data. I went straight to Fourier transforms, thinking that would provide insight into the fundamentals of visualizing data. This makes sense: the visualisation needed to be much more intuitive, something we are familiar with.
It wasn't enough that the data in question was processed; I had to understand how each set of data responded, beyond the interpretation of the numbers into how the data can be transformed into an interactive experience instinctively grasped by the audience. How can I let the data, speak to the audience in an accessible and intuitive way. Several iterations were done(although not nearly enough), experimenting with different approaches to find those that best presented the main concepts.
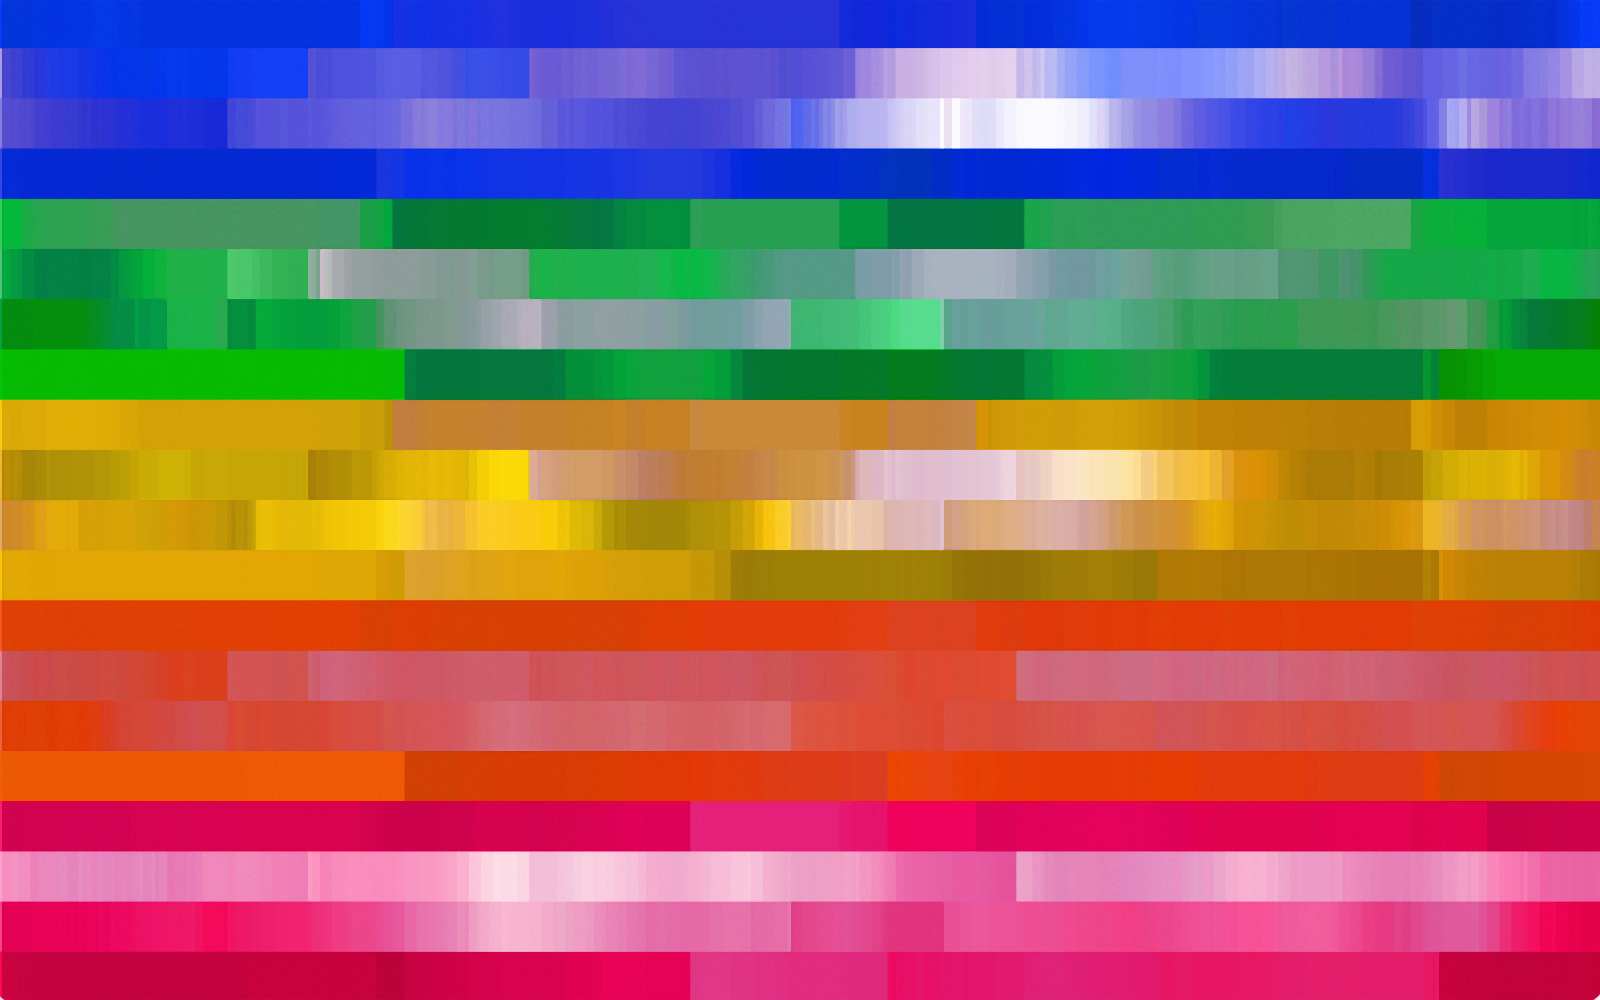
Data Visualisation
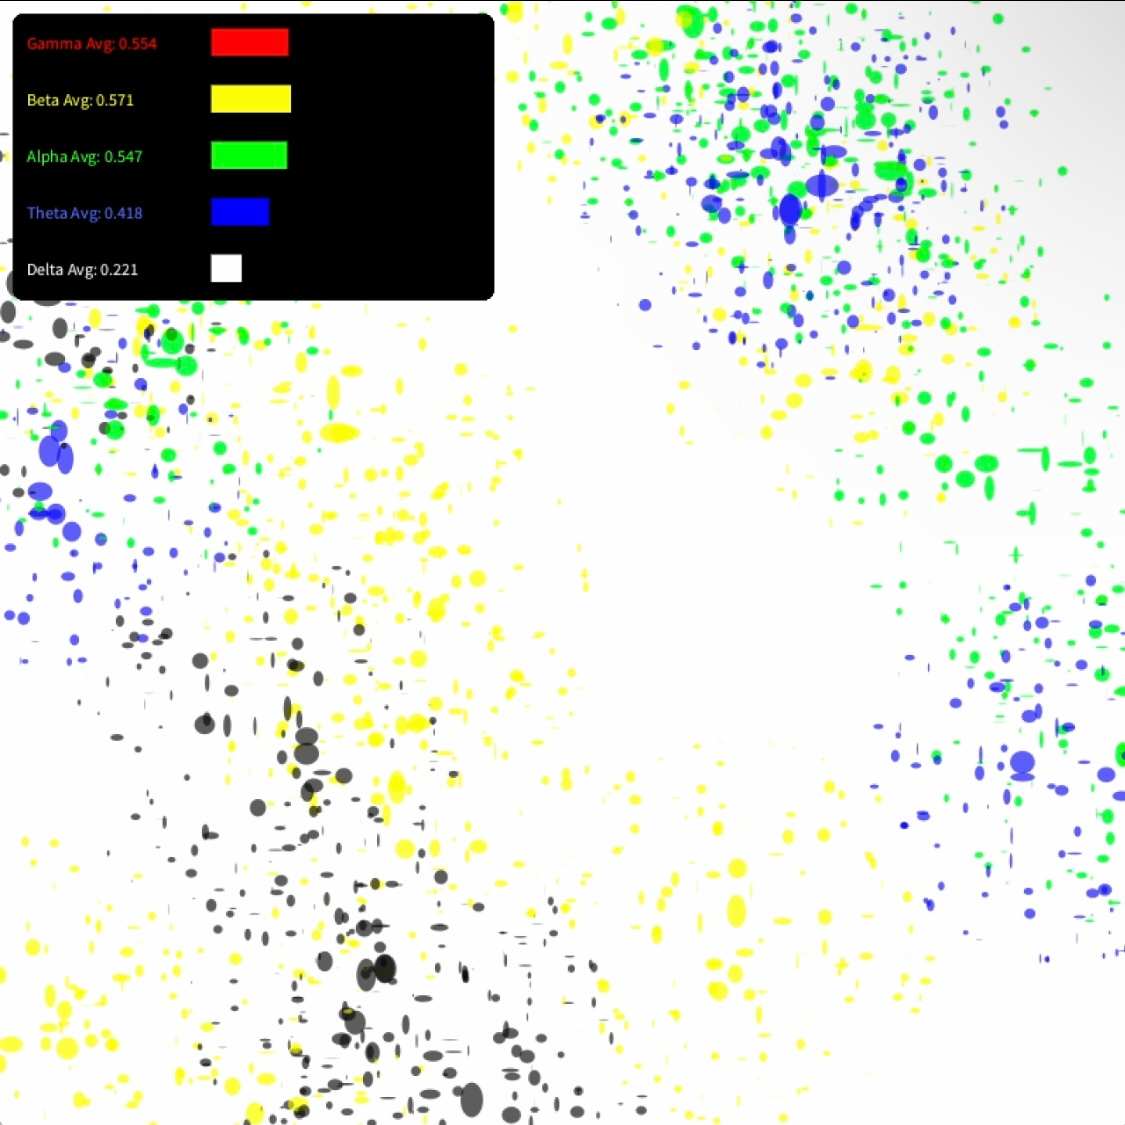
The first section of this experiment is a straightforward attempt at data visualisation in processing, and some data analysis output. The experiment was divided into three key data sets:
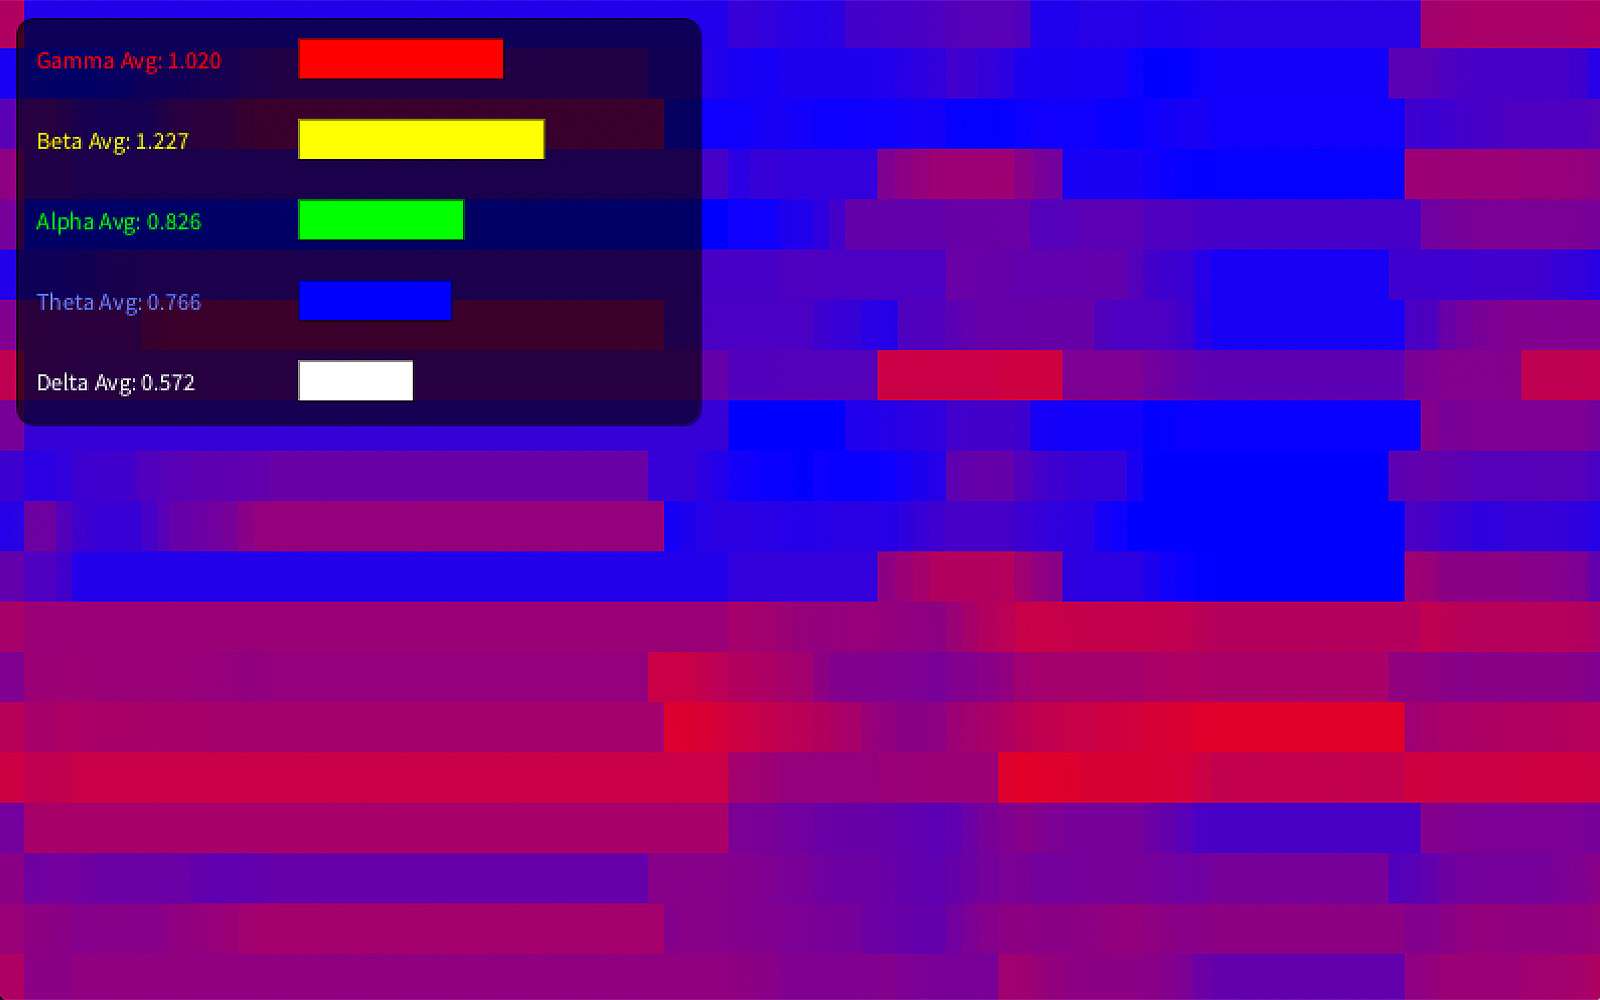
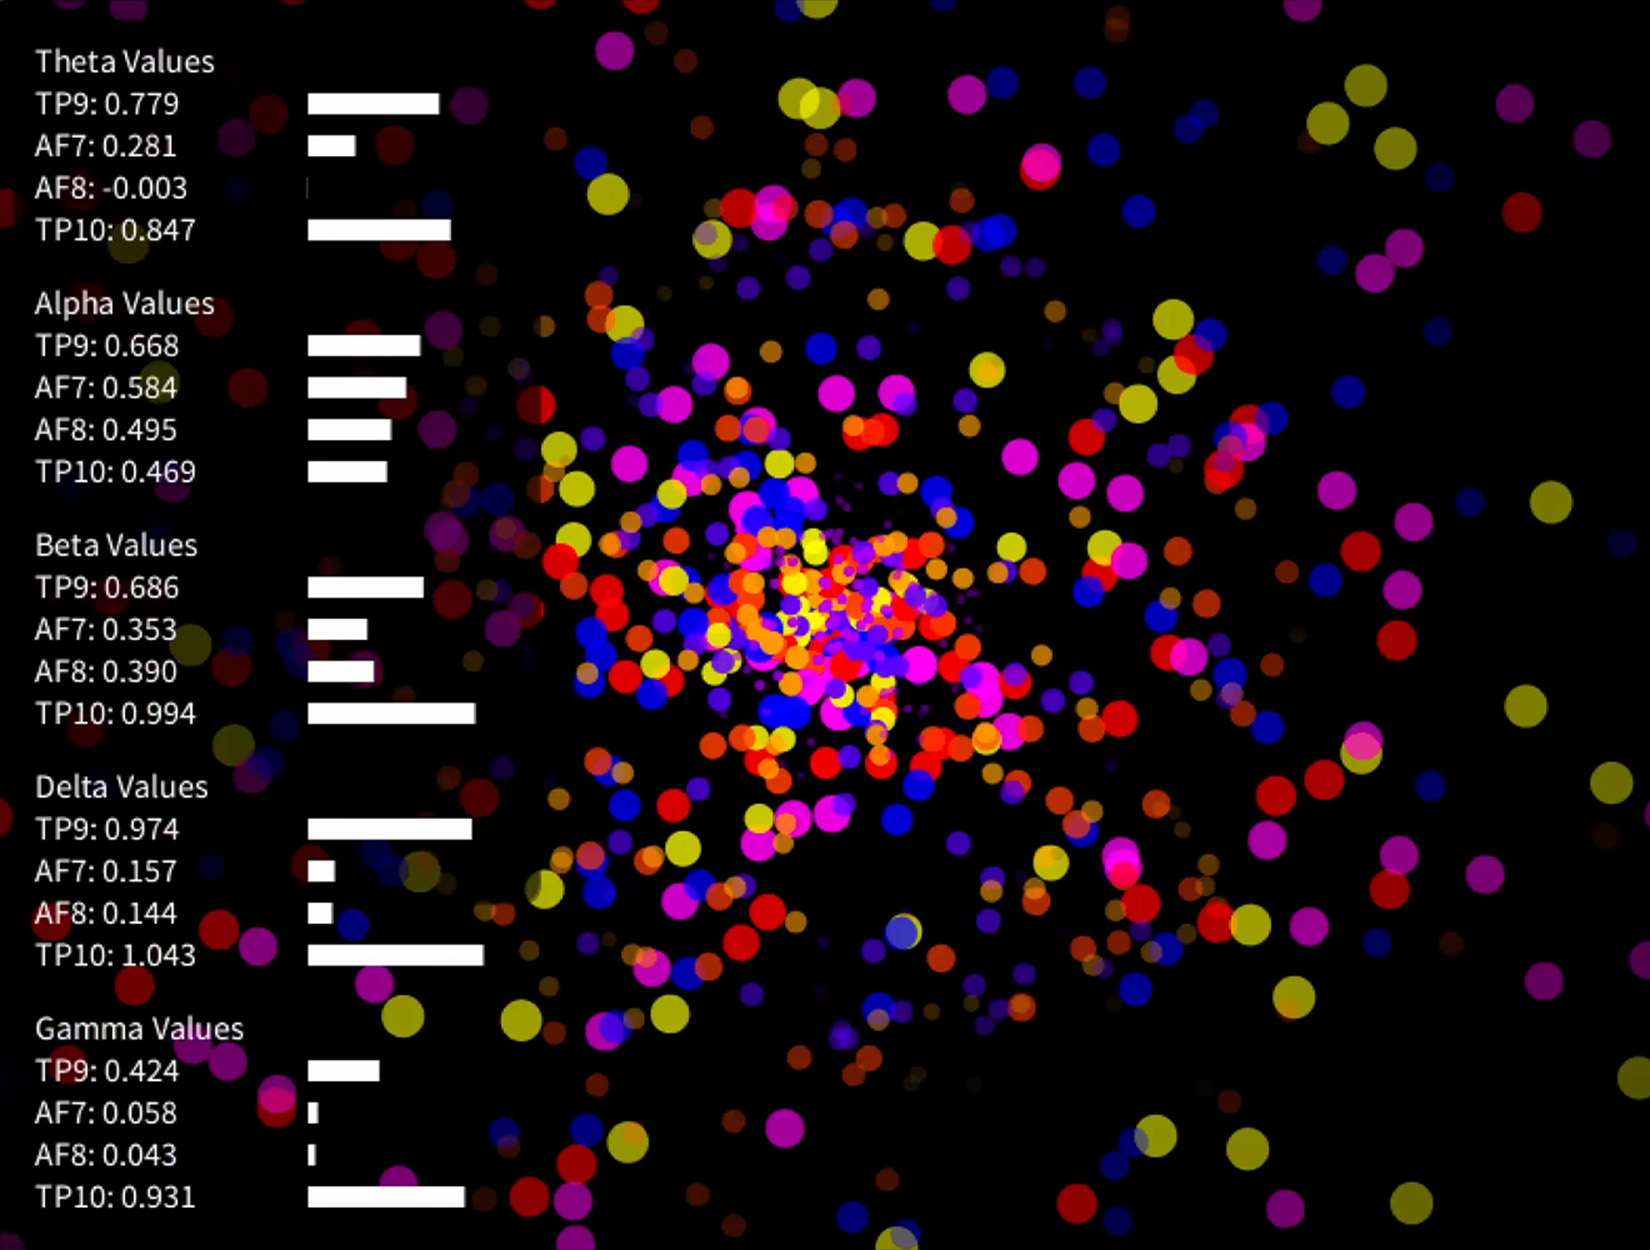
- Average for each five brainwave types—Alpha, Beta, Theta, Delta, and Gamma—which generalises brainwave activity.
- Absolute data give a total of 20 data points on region-specific brain activity, containing four floats for each type of brain wave.
- Absolute data of Alpha and Beta waves, selected for their variance in the conscious state.
- Absolute data of Theta and Alpha waves, selected for their representation of the subconscious state.
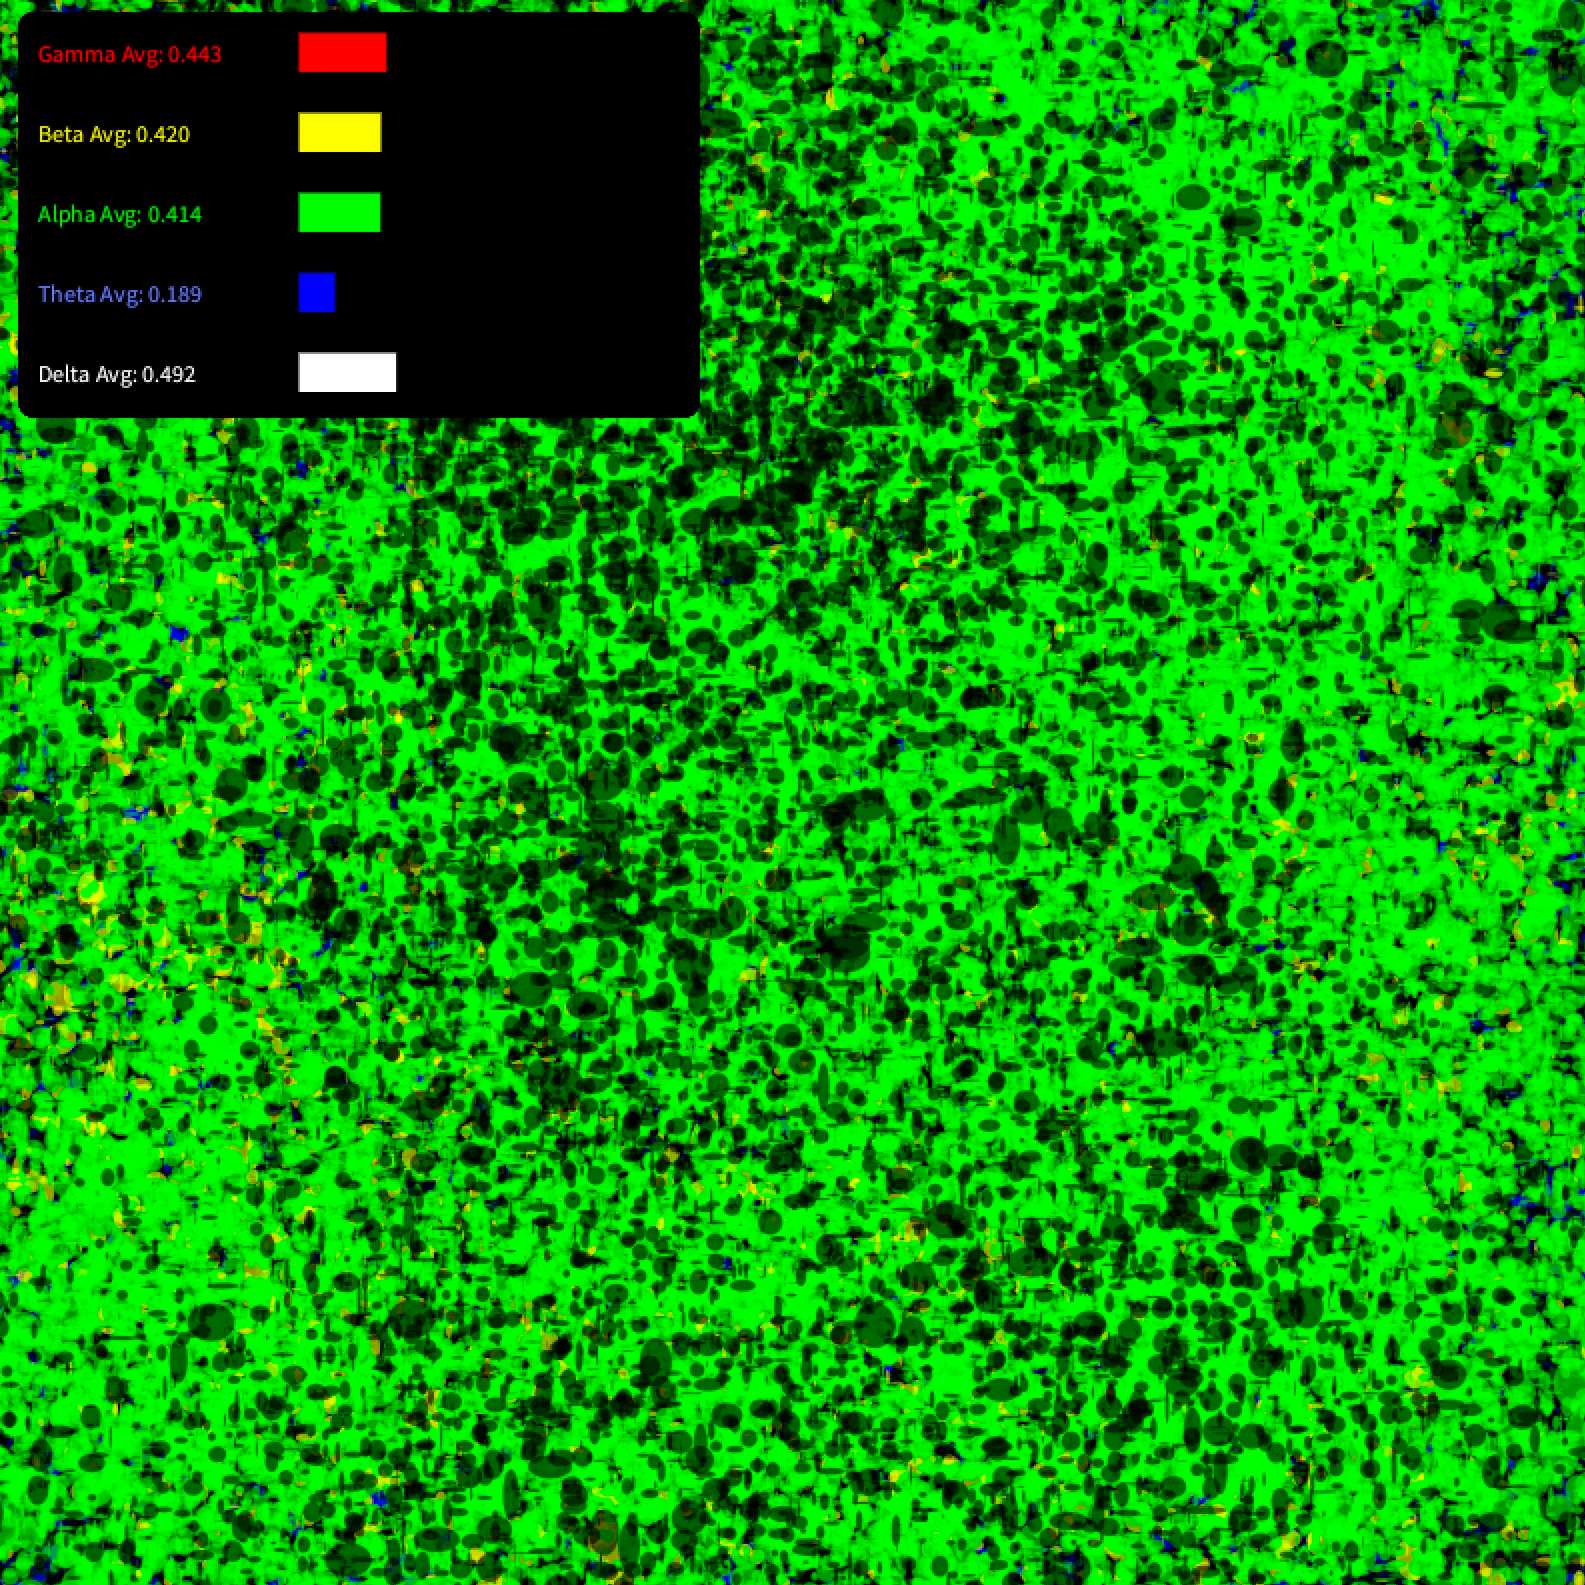
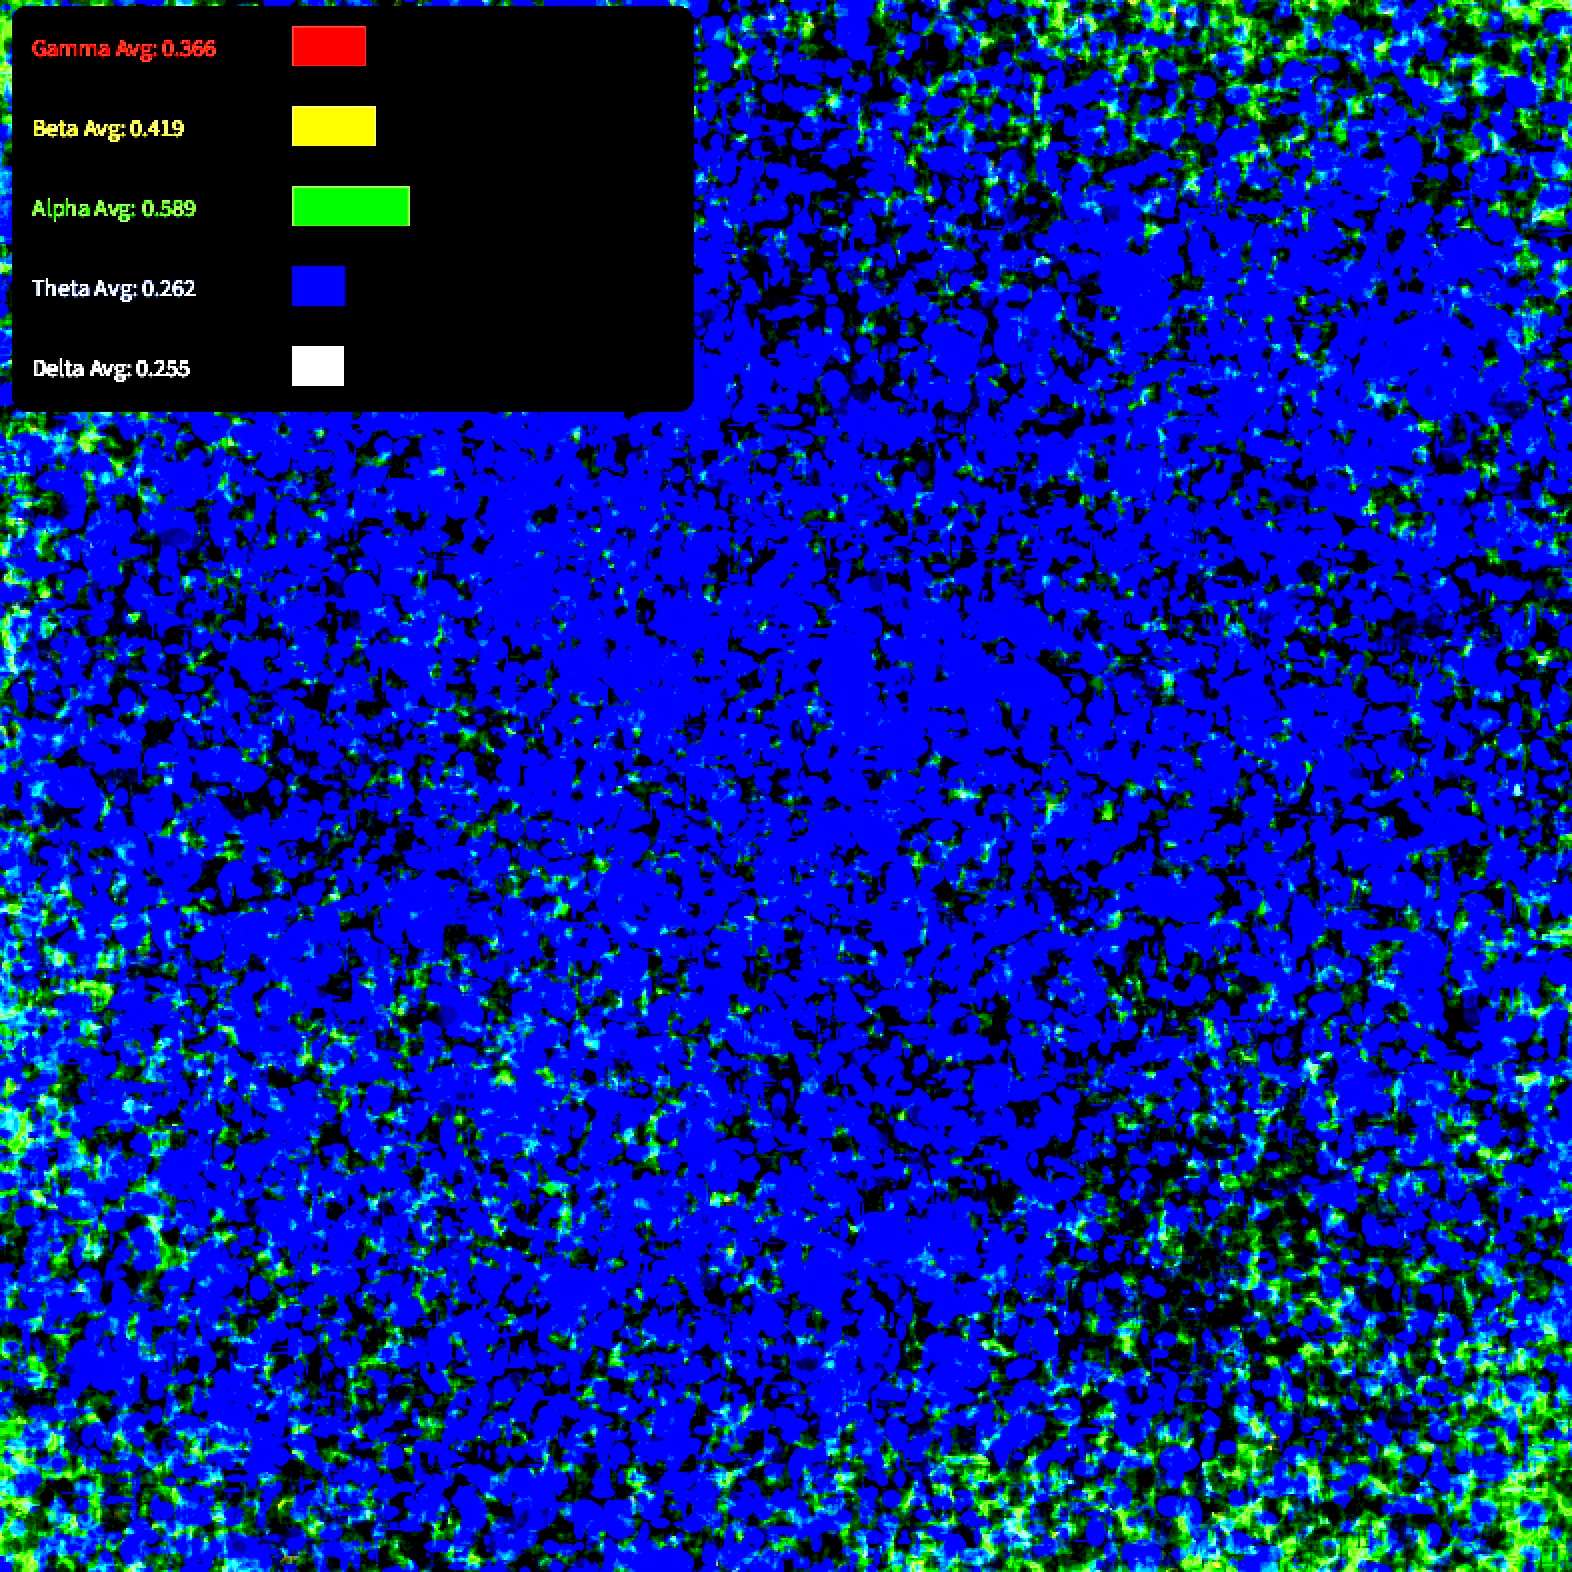
The second portion of the experiment tries to visualise the data to splatter effects. For Splatter A, a threshold was set to trigger the splatter effects based on when brainwave activity surpassed specific values. However, the initial results were erratic, as splatters continued to appear even when brainwave activity was aontinously above the threshold. Several options for this:
- Adjusting the frequency by modifying the frame count, allowing the splatters to occur less frequently while also representing the duration that the brainwaves stayed above the threshold.
- Triggering splatters only when brainwave activity crossed from below to above the threshold, aiming for clearer and more distinct visual events.
- Raising the threshold itself to reduce the splatter frequency, but this method may pose challenges in identifying a precise value that works across different inputs.
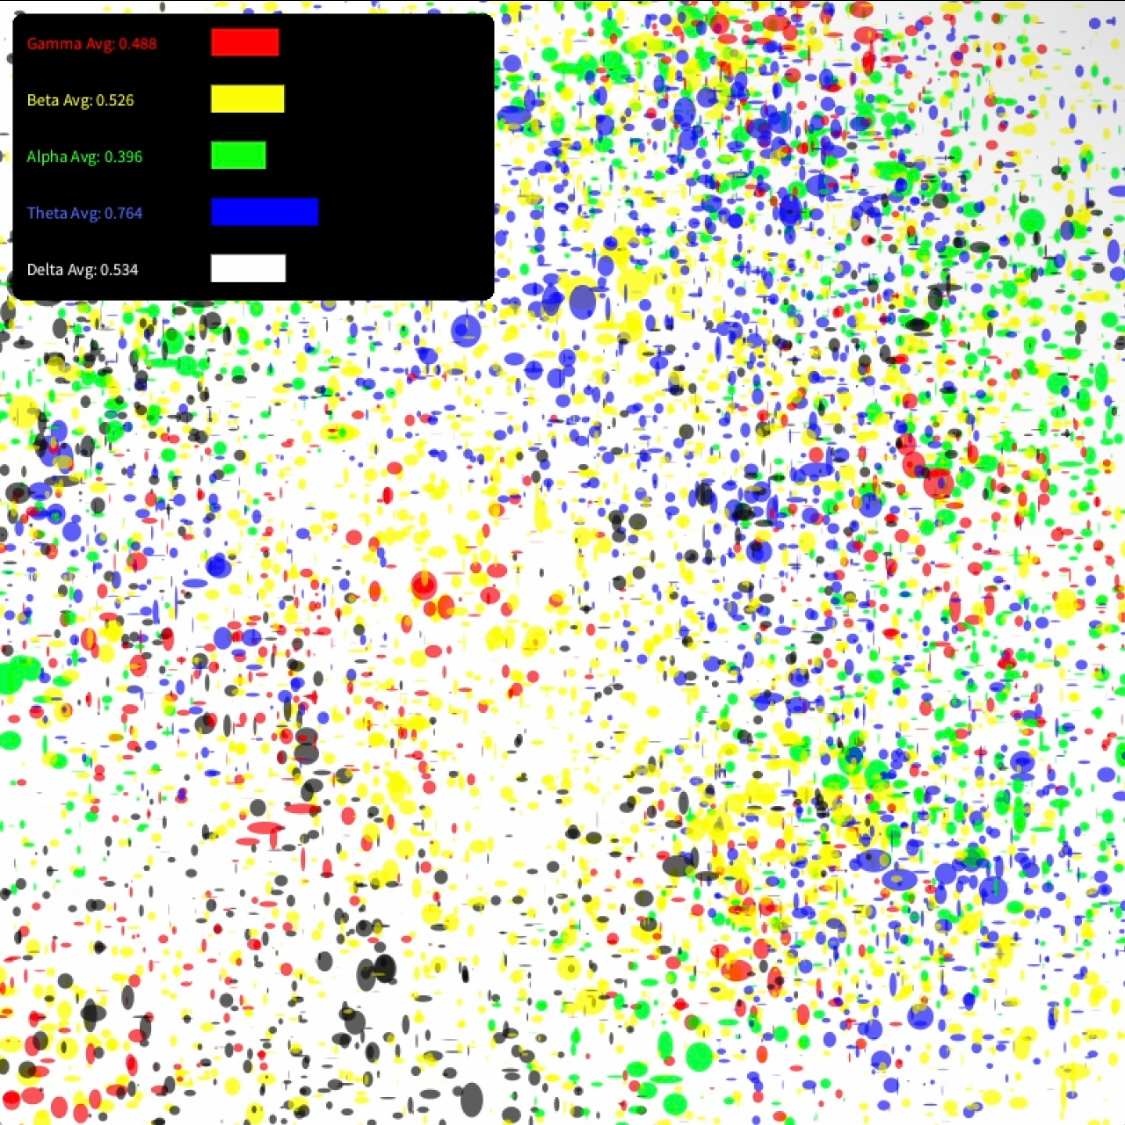
The first option was selected, so that adjusting the frequency could also reflect the duration of any brainwave that stayed above the threshold. This can lead to a more controlled and intentional visual feedback.
Splatter B does not rely on thresholds but instead concentrates on the most dominant brainwave at any given time. This was meant to make the interaction more engaging, as it shows more variety and a continuous rhythm for the drawing.
Narratives
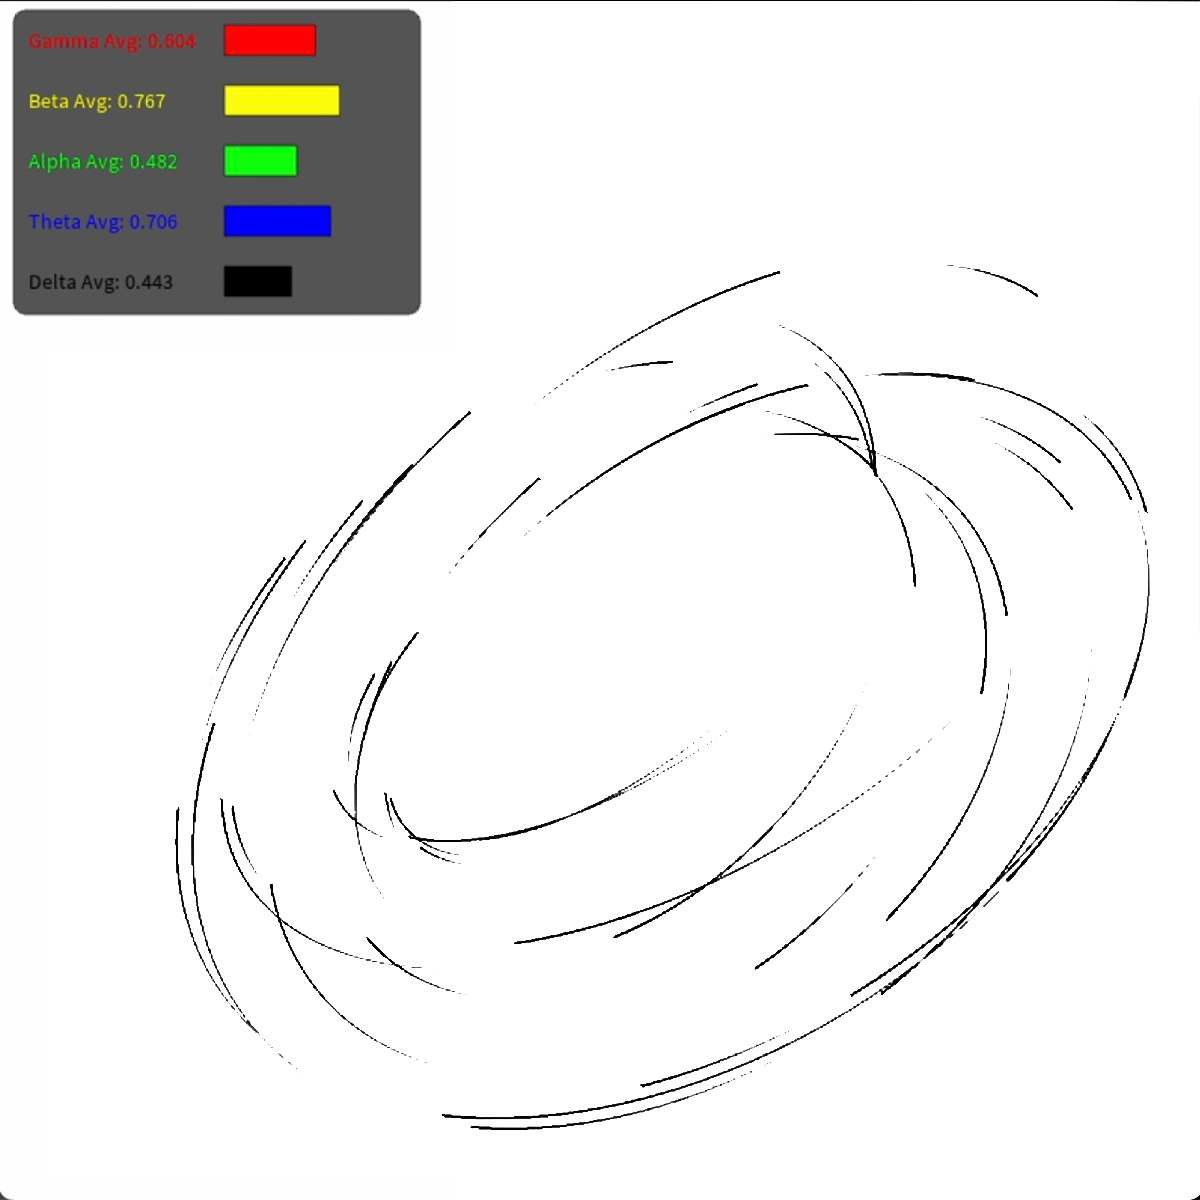
The third section is an attempt at visualisation with narrative context. Such as using theta waves to a pulsating visual to represent how theta rhythm can act as an internal clock that helps coordinate neuronal activity for encoding and retrieving memories. Or how the brain uses a toroidal / doughnut-shaped coordinate system, to process spatial information. Further experimentation is to be continued, but it is important to keep in mind not to fall down the rabbit hole of focusing too much on the narrative context that user experience is forgotten.